Electrifying Belmont: Could the Community Path Anchor a PV Solar Array?
By Vincent Stanton, Jr.
A condensed version of this article appeared in the July//August 2022 BCF Newsletter – Ed.
The settlement of Belmont was shaped by the opening of the Fitchburg Railroad in 1843. Today, 179 years later, the Fitchburg Commuter Rail Line, now owned by the MBTA, would be recognizable to a Belmont resident of 1843. Though the 19th-century stations are gone, and at-grade crossings in Belmont Center and Waverley Square were replaced in 1907 and 1952 by a bridge and a trench, respectively, the basic infrastructure (steel rails on wooden ties) and the route are the same.
That is about to change. As covered in the May/June 2022 BCF Newsletter, funding was approved last month to construct Phase 1 of the Belmont Community Path in 2026. This major new transportation infrastructure project will dramatically alter the landscape north of the tracks.
The imminent arrival of the path prompts the question: what other productive uses might be devised for the Fitchburg Line corridor? This article will explore the concept of siting a south-facing solar photovoltaic (PV) array along the tracks. A subsequent article will explore using such an array as the backbone of a more ambitious network of PV arrays connecting flat-roofed buildings and large parking lots flanking the Fitchburg Line in Belmont.
Conditions for a PV array
Aspects of path layout relevant to design of a PV array include length, orientation to the sun, and the presence of a substrate to which PV panels can be attached.
- The path will extend 6,090 feet from the west side of Brighton Street to the Clark Street Bridge and will be bordered on the railroad side by an eight-foot-tall chain link fence. (All path measurements are from the 25% design drawings for the Belmont Community Path submitted to the Mass Department of Transportation in November 2021 and downloadable from the project website.) The fence is tall enough to accommodate two rows of PV panels attached at angles to optimize capture of solar radiation while avoiding shadows.
- An MBTA service road will run between the tracks and fence, facilitating cleaning and maintenance of the panels or even seasonal repositioning for optimized solar ray collection.
- The 5,000-foot path segment between Belmont Center and Brighton Street is oriented almost due east-west (parallel to the equator), allowing a due south-facing PV array facing the tracks, perfectly positioned for optimal sun collection and not shaded at any time of day. East of Brighton Street, the first 689 feet of the existing Fitchburg Cutoff Path are also located in Belmont and share the same properties (south facing, no shadows).
- West of Belmont Center the path bends southwest, and during some parts of the year, sections will be shaded in early morning and late afternoon by tall trees on the south side of the tracks, mostly during the winter months. However that afternoon shade should not meaningfully affect overall performance of the array, which is mostly driven by mid-day electricity generation.
- Close to the Clark Street Bridge, the path gradually rises 20 feet from track level to the bridge, with a 387-foot-long rip rap (loose stone) wall covering the steeply angled slope from the path down to track level. The surface area of the rip rap wall is not provided in the drawings, but I estimate it is about 7,700 square feet. That wall could be covered with PV panels angled to face south at a 45 degree angle.
- The proposed PV array would be near important Belmont Light Department infrastructure: within 100 feet of the substation on Flanders Road, and within a few feet of the substation behind the old Belmont Municipal Light Department building on Concord Avenue.
- Mounting panels on the fence between the path and the tracks would provide an additional layer of separation from train noise and possible debris.
- The entire project would occupy an industrial brownfield site with no green potential, in contrast to the proposed array at the former Belmont incinerator site.
Array size, design, and output
Design of a fence-mounted PV array is a job for an engineer, but some simple calculations allow a crude estimate of likely capacity and performance. One possible arrangement of two rows of fence-mounted panels is illustrated in Figure 5. Panel angles were selected to avoid shadows even on the summer and winter solstices, when the sun elevation is at its extremes (71 and 24 degrees, respectively, in Belmont).
The length of the fence to which the proposed array would be mounted is 6,779 feet (6,090 ft new construction + 689 ft Fitchburg Cutoff, where the existing 5-foot fence would be replaced with an 8-foot fence). Commercial PV modules generally measure 6.5 x 3.25 feet. Inserting a 3-inch gap between panels to allow horizontal rotation translates to one panel every 6.75 feet, or 1,004 panels (6,779 / 6.75). Doubling the number of panels to exploit the height of the fence yields 2,008 panels. The wall near the Clark Street Bridge will accommodate an additional 326 panels, assuming 3 inches of clearance on all sides (i.e., 6.75 x 3.5 ft spacing). That makes for a total of 2,008 + 326 = 2,334 panels.
An array of 2,334 standard commercial panels (300 watts nominal output per panel) has a capacity of 700,200 watts, while high-efficiency 400-watt panels would generate a nominal 933,600 watts. However, in order to estimate the real-world power output of an array it is necessary to specify aspects of the site and installation, including the location, the efficiency of the panels, the angle at which they are tilted, the local weather and many other factors. The US Department of Energy’s National Renewable Energy Laboratory (NREL) provides an online calculator called PVWatts that takes into account all of those factors, while assuming 96% inverter efficiency and a 14% loss factor (based on typical system losses). With 19% efficient panels, the PVWatts calculator estimates annual output of 933,247 kilowatt hours (KWH) of alternating current from the illustrated PV array, ranging from 57,433 KWH in December to 90,689 KWH in July. More efficient panels (23% rather than 19%) could increase output by about 20%.
Three non-standard panel designs that could further enhance electricity generation are motorized sun tracking (albeit at the cost of the motor and electricity to run it), bifacial PV panels, and reflectors to increase the amount of light directed at the panels. The PVWatts calculator projects that one-axis motorized sun tracking (constant tilt angle but rotating from east to west during the day) would increase annual output 21.8%; however, to fully realize that gain would require more than 3 inches of space between panels to avoid shadows. Panels can also be manually adjusted twice or four times a year. Spring and fall manual adjustment can improve yield by about 5%.
Bifacial panels, as the name suggests, have solar cells on both sides. They make sense when it is possible to reflect light onto the back surface of the panel, as would be the case with a ground-mounted system. Bifacial panels cost about $0.10 more per watt and can increase power output on the order of 10% based on limited study.
The use of mirrors, or booster reflectors, to increase power output is another emerging technology; a recent pilot study showed that gains of up to 30% may be possible depending on the details of the setup (see Figure 7 for one possible mirror design). A combination of measures might reasonably be expected to boost annual system output by 40% to 50% to around 1,400,000 KWH, or alternatively to maximize system performance at times of high demand.
Finally, the chain-link fence designed to separate path users from the tracks may not be strong enough, or have the right supports, to hold two rows of panels. Commercial panels weigh about 50 pounds, so the cumulative weight borne by the fence would be about 100 pounds per 6.75 feet, or about 14.8 pounds per foot. A more expensive fence may be necessary. However, this could also be an opportunity to create a bigger array by replacing the 5-foot fence east of Brighton Street with a taller fence and extending it along the tracks into Cambridge (still on MBTA property).
Project ownership and coordination: MBTA and Belmont Light?
The entire PV array would be on MBTA property, as is most of the path. The MBTA owns approximately 40 feet north of the Fitchburg Line tracks. Why should the MBTA be interested in collaborating on a solar energy project?
First, the electrification of the commuter rail system is coming, though details and funding have not been worked out. From the MBTA’s website, under the heading Greening the Fleet: Decarbonizing the MBTA:
“As the MBTA plans for the future of the commuter rail system, we are considering the transition from diesel locomotives to an electrified system… . The MBTA has launched the Rail Vision program that will identify cost-effective strategies to transform the existing commuter rail system. The modernized system will offer improved mobility and support our efforts to reduce greenhouse gas emissions.”
The advocacy group TransitMatters issued a detailed report last fall showing how the MBTA could electrify the entire commuter rail network for between $800 million and $1.5 billion.
Second, the MBTA is already generating large amounts of electricity from solar. In 2019, it finished installing solar canopies at 37 MBTA parking lots and garages.
These projects have been financed with a variety of partners. For example, all power generated by a 684 KW array installed over the parking lot at Nantasket Junction Station, and a 360 KW array covering the parking lot at West Hingham Station, is being purchased by Hingham Light, a municipally owned utility, via a power purchase agreement.
This innovative partnership could be a template for a relationship between the MBTA and Belmont Light. Though the MBTA is currently selling solar power to Hingham, the electrification of the commuter rail system, when it happens, will create increased demand for power, likely making the MBTA a buyer. Countries including India, England, and Germany are ahead of the United States in directly coupling rail-side solar PV installations to the electric traction systems that power the trains.
The MBTA is not in the electric generation and distribution business. Indeed, the 37 PV arrays on MBTA property were built and are maintained and owned by a developer who leases the space from the MBTA, which expects $55 million in rental income and savings on snow removal over the 20-year lease. That suggests a template wherein Belmont Light would be the developer, operator, and owner of an array along the path, leasing the space from the MBTA. The contract might include a future electricity purchase option for the MBTA, anticipating electrification of the commuter rail, but also to charge electric buses that stop next to the path at the Belmont Center and Waverley Stations.
Project economics: adding battery backup
It will be years before the Fitchburg Line is electrified and the MBTA becomes a customer. To make a solar PV array economically attractive to Belmont Light today will likely require installing batteries which would allow supply and demand to be better matched.
To appreciate how addressing peak demand affects electricity prices, start by recognizing that the reliability of our electric system, at both the local and regional level, depends on having the capacity to deliver whatever amount of power is needed during the most energy-intensive hour of the year. In practice, that means maintaining a system that can deliver considerably more power than is needed on the average day.
For example, one important rationale for Belmont Light’s construction of a new 115 kV substation on Flanders Road (completed in 2016 at a net cost of $26.1 million) was that the old infrastructure would not have been able to handle increasing peak demand. At a regional level, about 20% of the electric generating capacity deemed necessary by the New England power regulator (ISO-NE), is used only 2% of the time. It is expensive to maintain that extra capacity, and the cost is reflected in a forward capacity charge that is determined by power usage at peak hours in the previous year. Capacity charges are unpredictable (though the trend is up ); they have varied four fold . Thus, if Belmont Light were able to consistently and predictably reduce its peak demand, it would lower its capacity charges and hence its rates for Belmont residents.
In addition to capacity charges, the marginal price of electricity at times of high demand is a cost driver. As covered in the August/September 2014 BCF Newsletter (“Solar Electricity Pricing Plans Debated”), on hot summer days when electric demand is at its peak, Belmont Light (like other utilities) has to buy electricity on the spot market to supplement electricity purchased via long-term contracts. Spot prices tend to be high at such times; 10 to 20-fold variation in price is not unusual. In short, being able to predictably reduce spot market purchases also reduces costs. Together with the forward capacity charge reductions, these spot price reductions are transformational for solar PV economics.
The best publicized example of the powerful economics of battery storage plus intermittent renewable power (solar or wind) is a 100 megawatt (MW) Tesla battery installation in South Australia, which reportedly saved about $35M in its first four months of service in late 2017, while reducing the cost of conventional power backup (mostly gas-fired turbines) by 90%. The $50M system paid for itself in six months.
The attractive economics of solar PV coupled with battery storage have also been demonstrated locally by Sterling Municipal Light (SMLD), a Massachusetts utility which offers some of the lowest electric rates in the state. SMLD operates over 4.5 MW of PV in Sterling, built and owned by independent developers who signed power purchase agreements with the utility. In 2016, SMLD installed a 2 MW/3.9 MWH battery storage facility at a cost of $2.7 million, defrayed by $1.71M in state and federal grant support. Sterling lowers its demand for electricity from ISO-NE by discharging the battery system during peak demand hours. The system saves electric ratepayers about $400,000 per year by decreasing costs associated with capacity and transmission charges. With the grant support, the project had a payoff period of 2.5 years (vs. 7 years without grants). An additional benefit of the Sterling system is that it provides a dependable power source for first responders as part of an overall municipal vulnerability preparedness plan. Sterling has a population of 8,190 (one third of Belmont), so the scale of a battery system in Belmont would likely be larger.
Unlike Sterling and several other municipally owned Massachusetts utilities, Belmont Light does not own any electrical-generating capacity, so it must purchase all of its power. Participating in the design of an array would allow Belmont Light to optimize design features to the contours of Belmont demand (e.g., orienting panels to produce more electricity in the late afternoon closer to peak demand).
How to finance such a project is beyond the scope of this article, but it is worth noting that the level of participation of Belmont citizens in solar roof and electric car promotions sponsored by the Energy Committee in recent years have been among the highest in the state, yet many residents are not able to participate either because their roof is not suitable for solar, was just replaced, or they can’t afford the upfront costs of a roof array or an electric car. Instead, Belmont residents could purchase interest-bearing bonds to finance construction of a PV array from which they (via Belmont Light) would be purchasing power. Littleton Electric Light customers have piloted such a program.
Potential extension to town-owned and private property flanking the path
The array discussed here utilizes Phase 1 of the Belmont Community Path project. Phase 2 of the path, from the Clark Street Bridge to the Waltham line, would be expected to nearly double the size of a PV array. A much bigger opportunity, however, lies in all of the flat-topped industrial buildings and large parking lots that lie within 150 feet of the path. A future article will explore how construction of PV arrays on even half of the available surfaces could produce a network of arrays with electrical generating capacity close to 10 MW, with no loss of green space.
Vincent Stanton, Jr., is a director of the Belmont Citizens Forum and a member of the Belmont Community Path Project Committee. However, the ideas and opinions in this article are his alone.
Figures
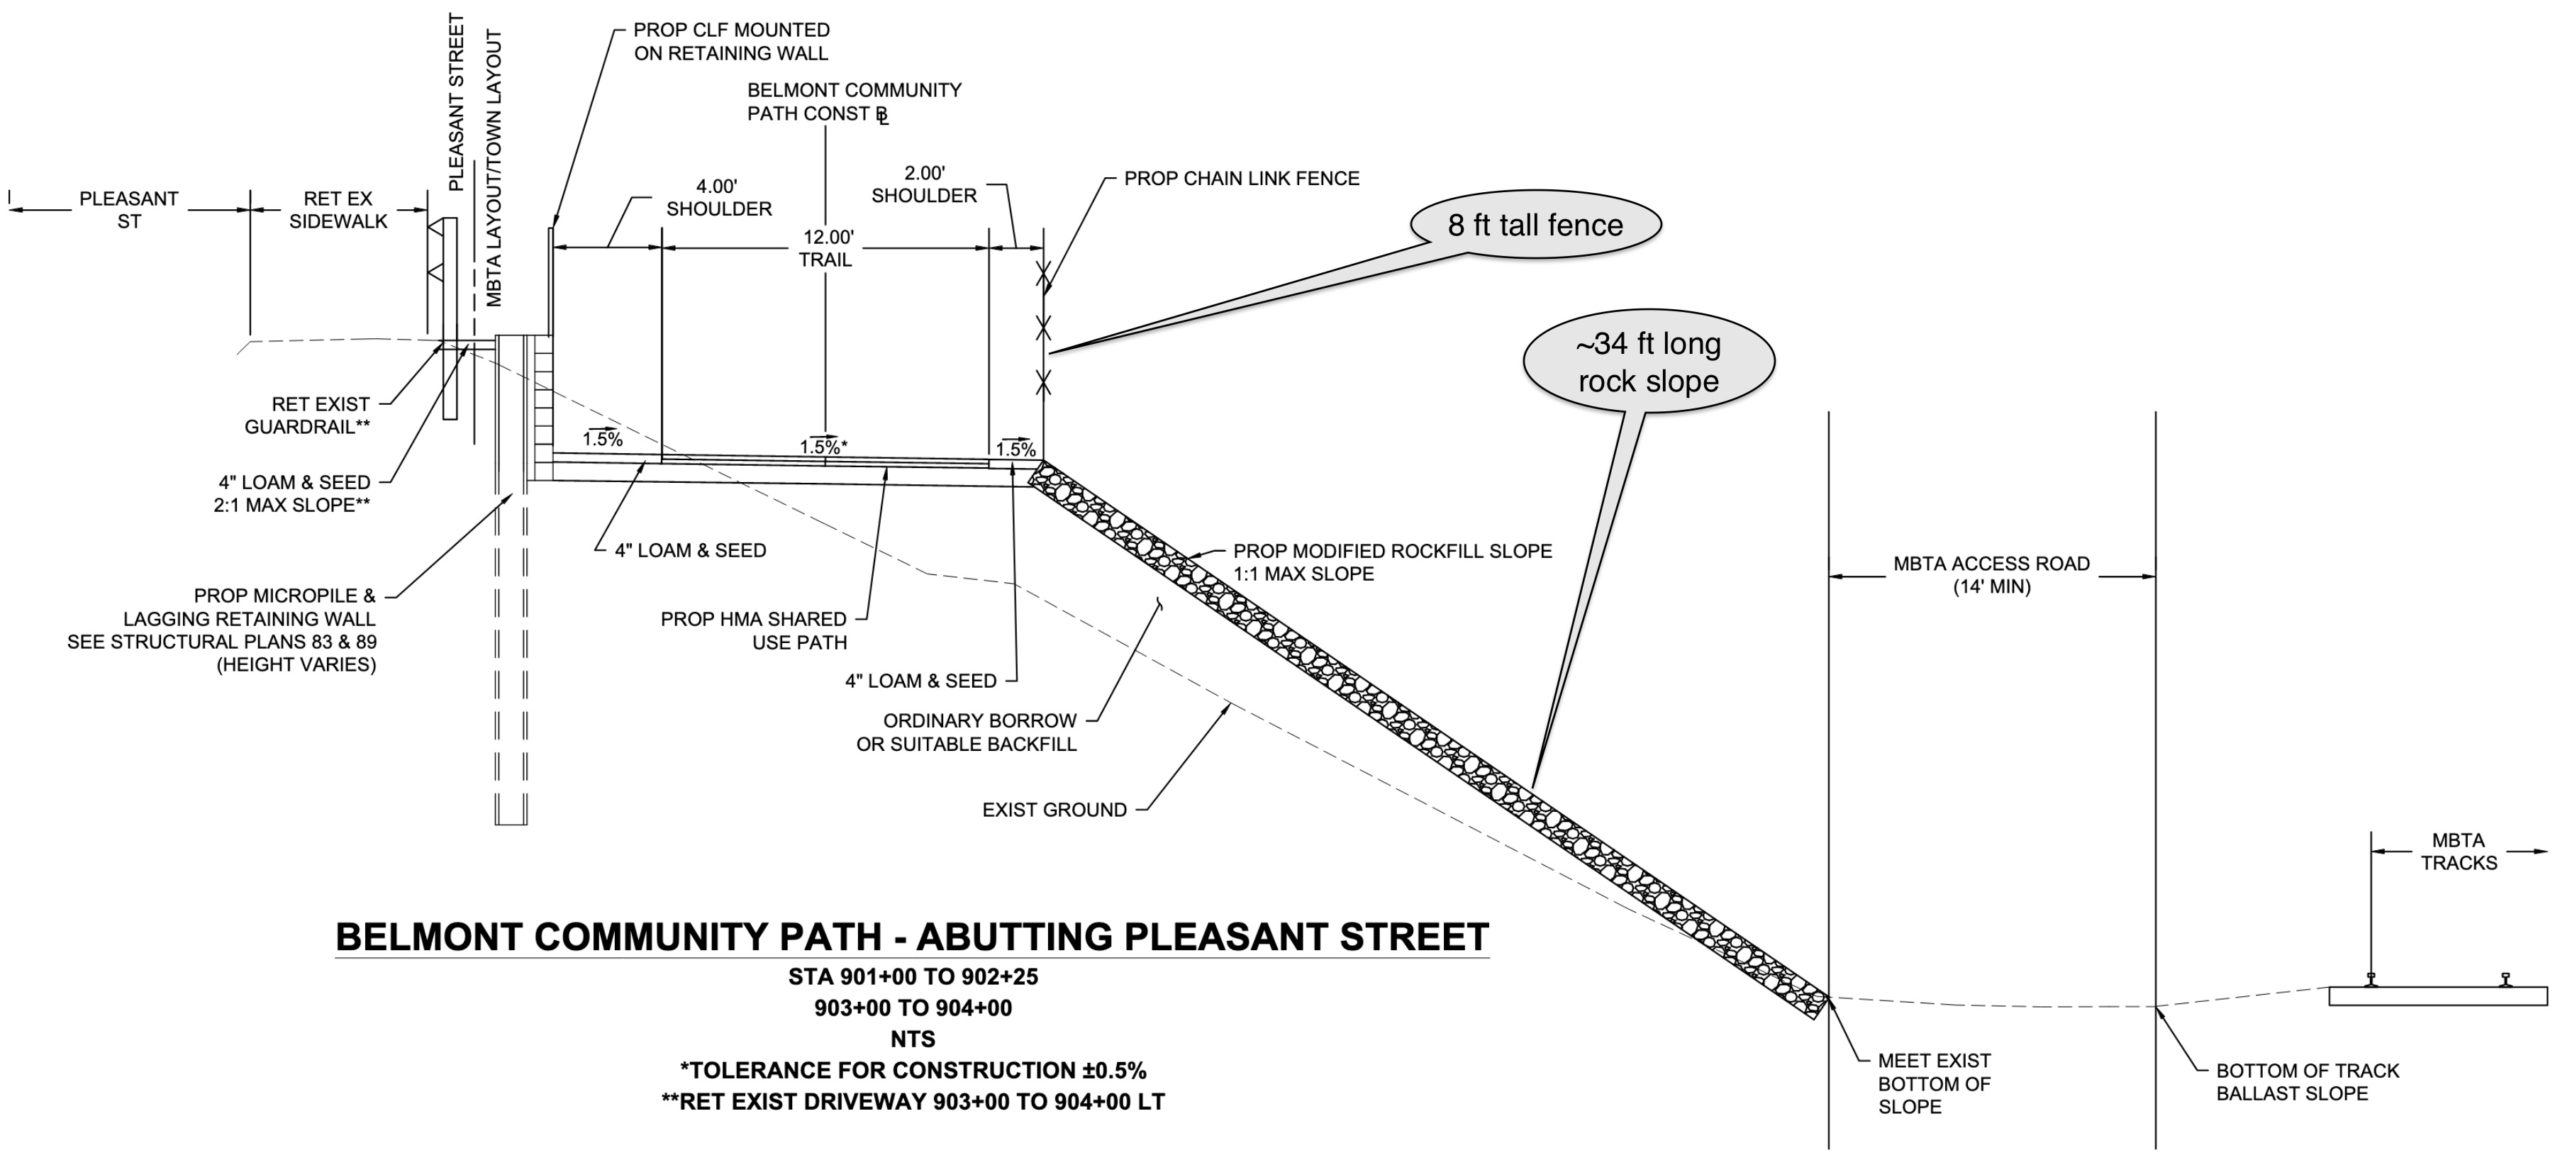
Fig. 1. Belmont Community Path 25% design plans (detail from Sheet 5) showing 8-foot fence near Clark Street Bridge, flanked by the path to the north and to the south a rock wall descending at a 45 degree angle from the path to track level (explanatory bubbles added).
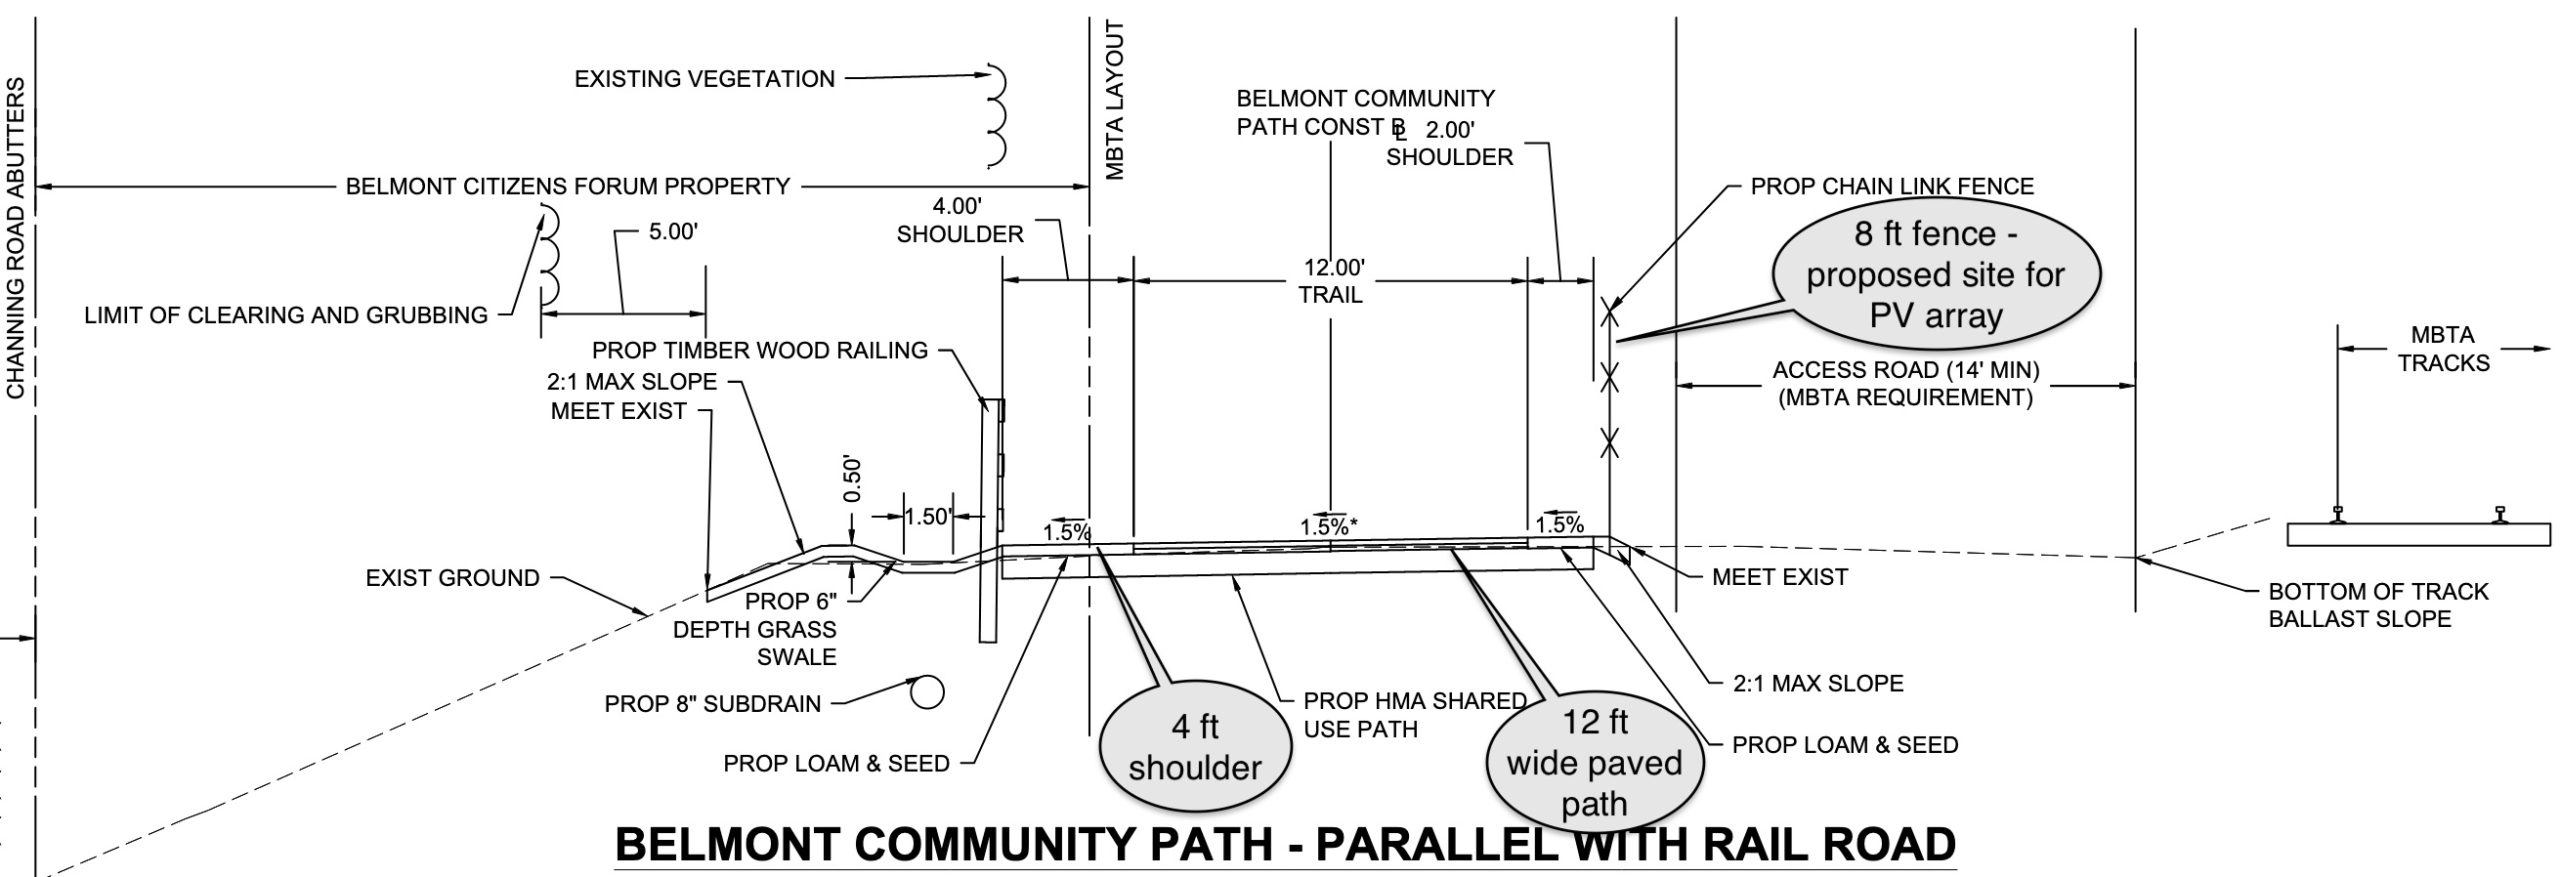
Fig. 2. Belmont Community Path 25% design plans (detail from Sheet 5) showing 8-foot fence path behind Belmont High School, including location of 8-foot fence at edge of path and MBTA service road (explanatory bubbles added).
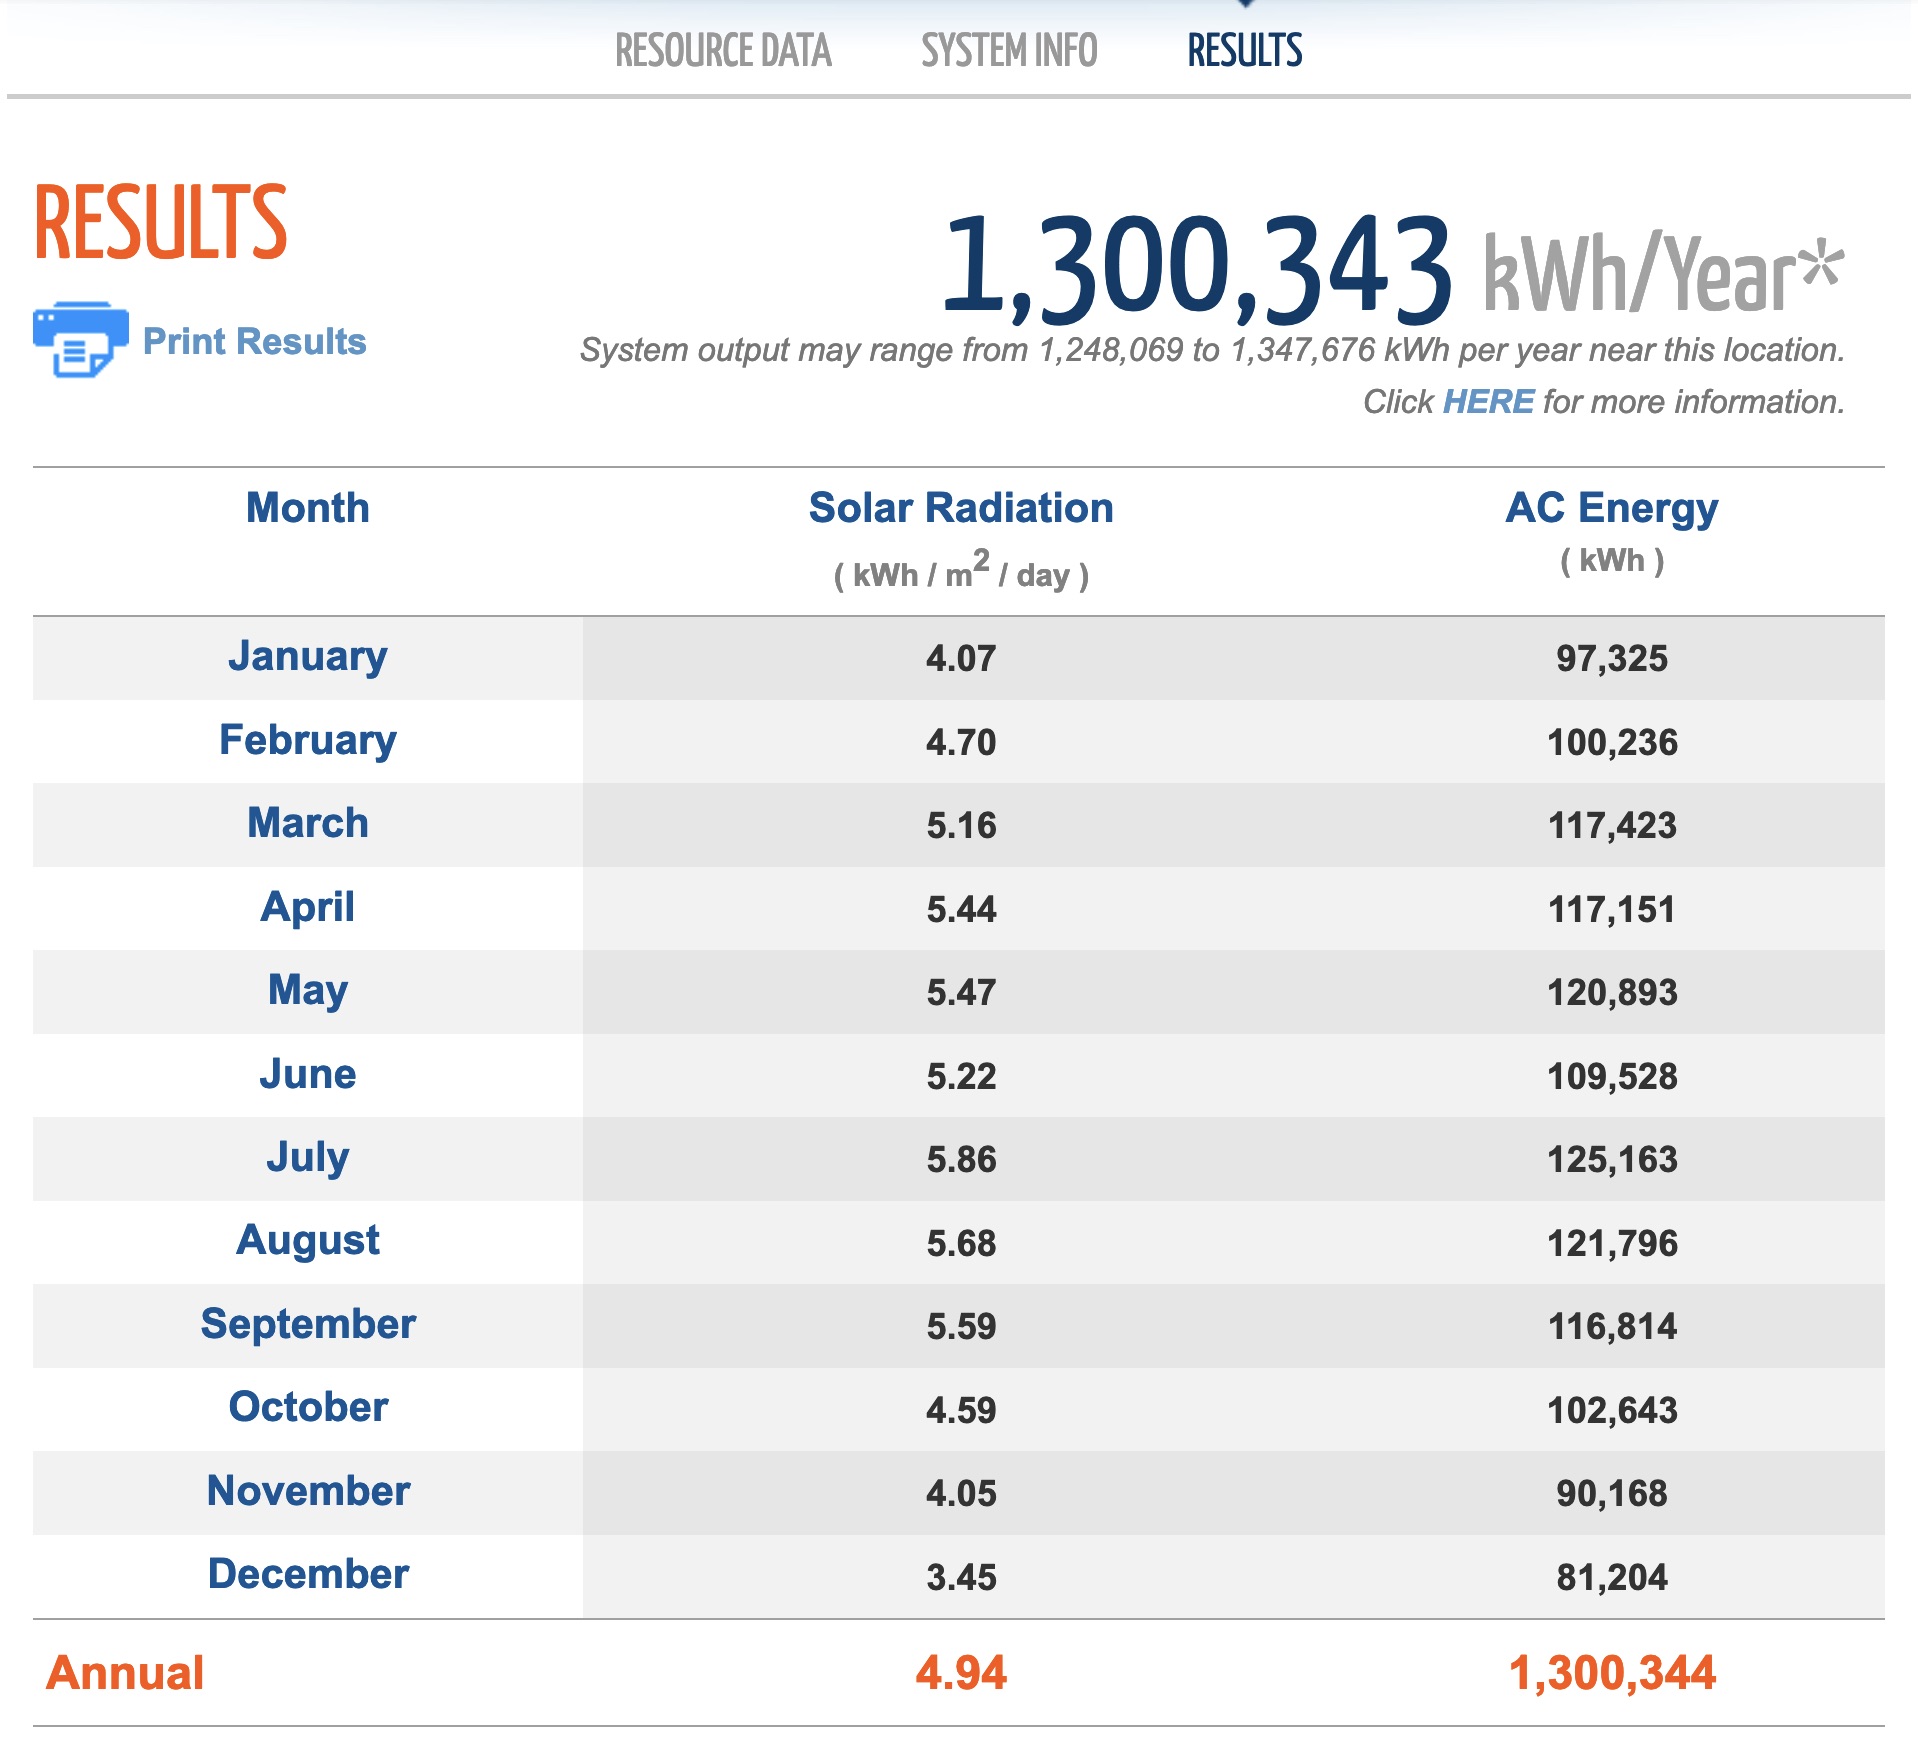
Fig. 3. PVWatts calculator output for a fixed array (nominal capacity 933 KW) composed of 19% efficient PV panels in Belmont (42.41 degrees latitude, -71.18 degrees longitude), inclined at 45 degrees, assuming 14.1% system losses and 96% inverter efficiency.
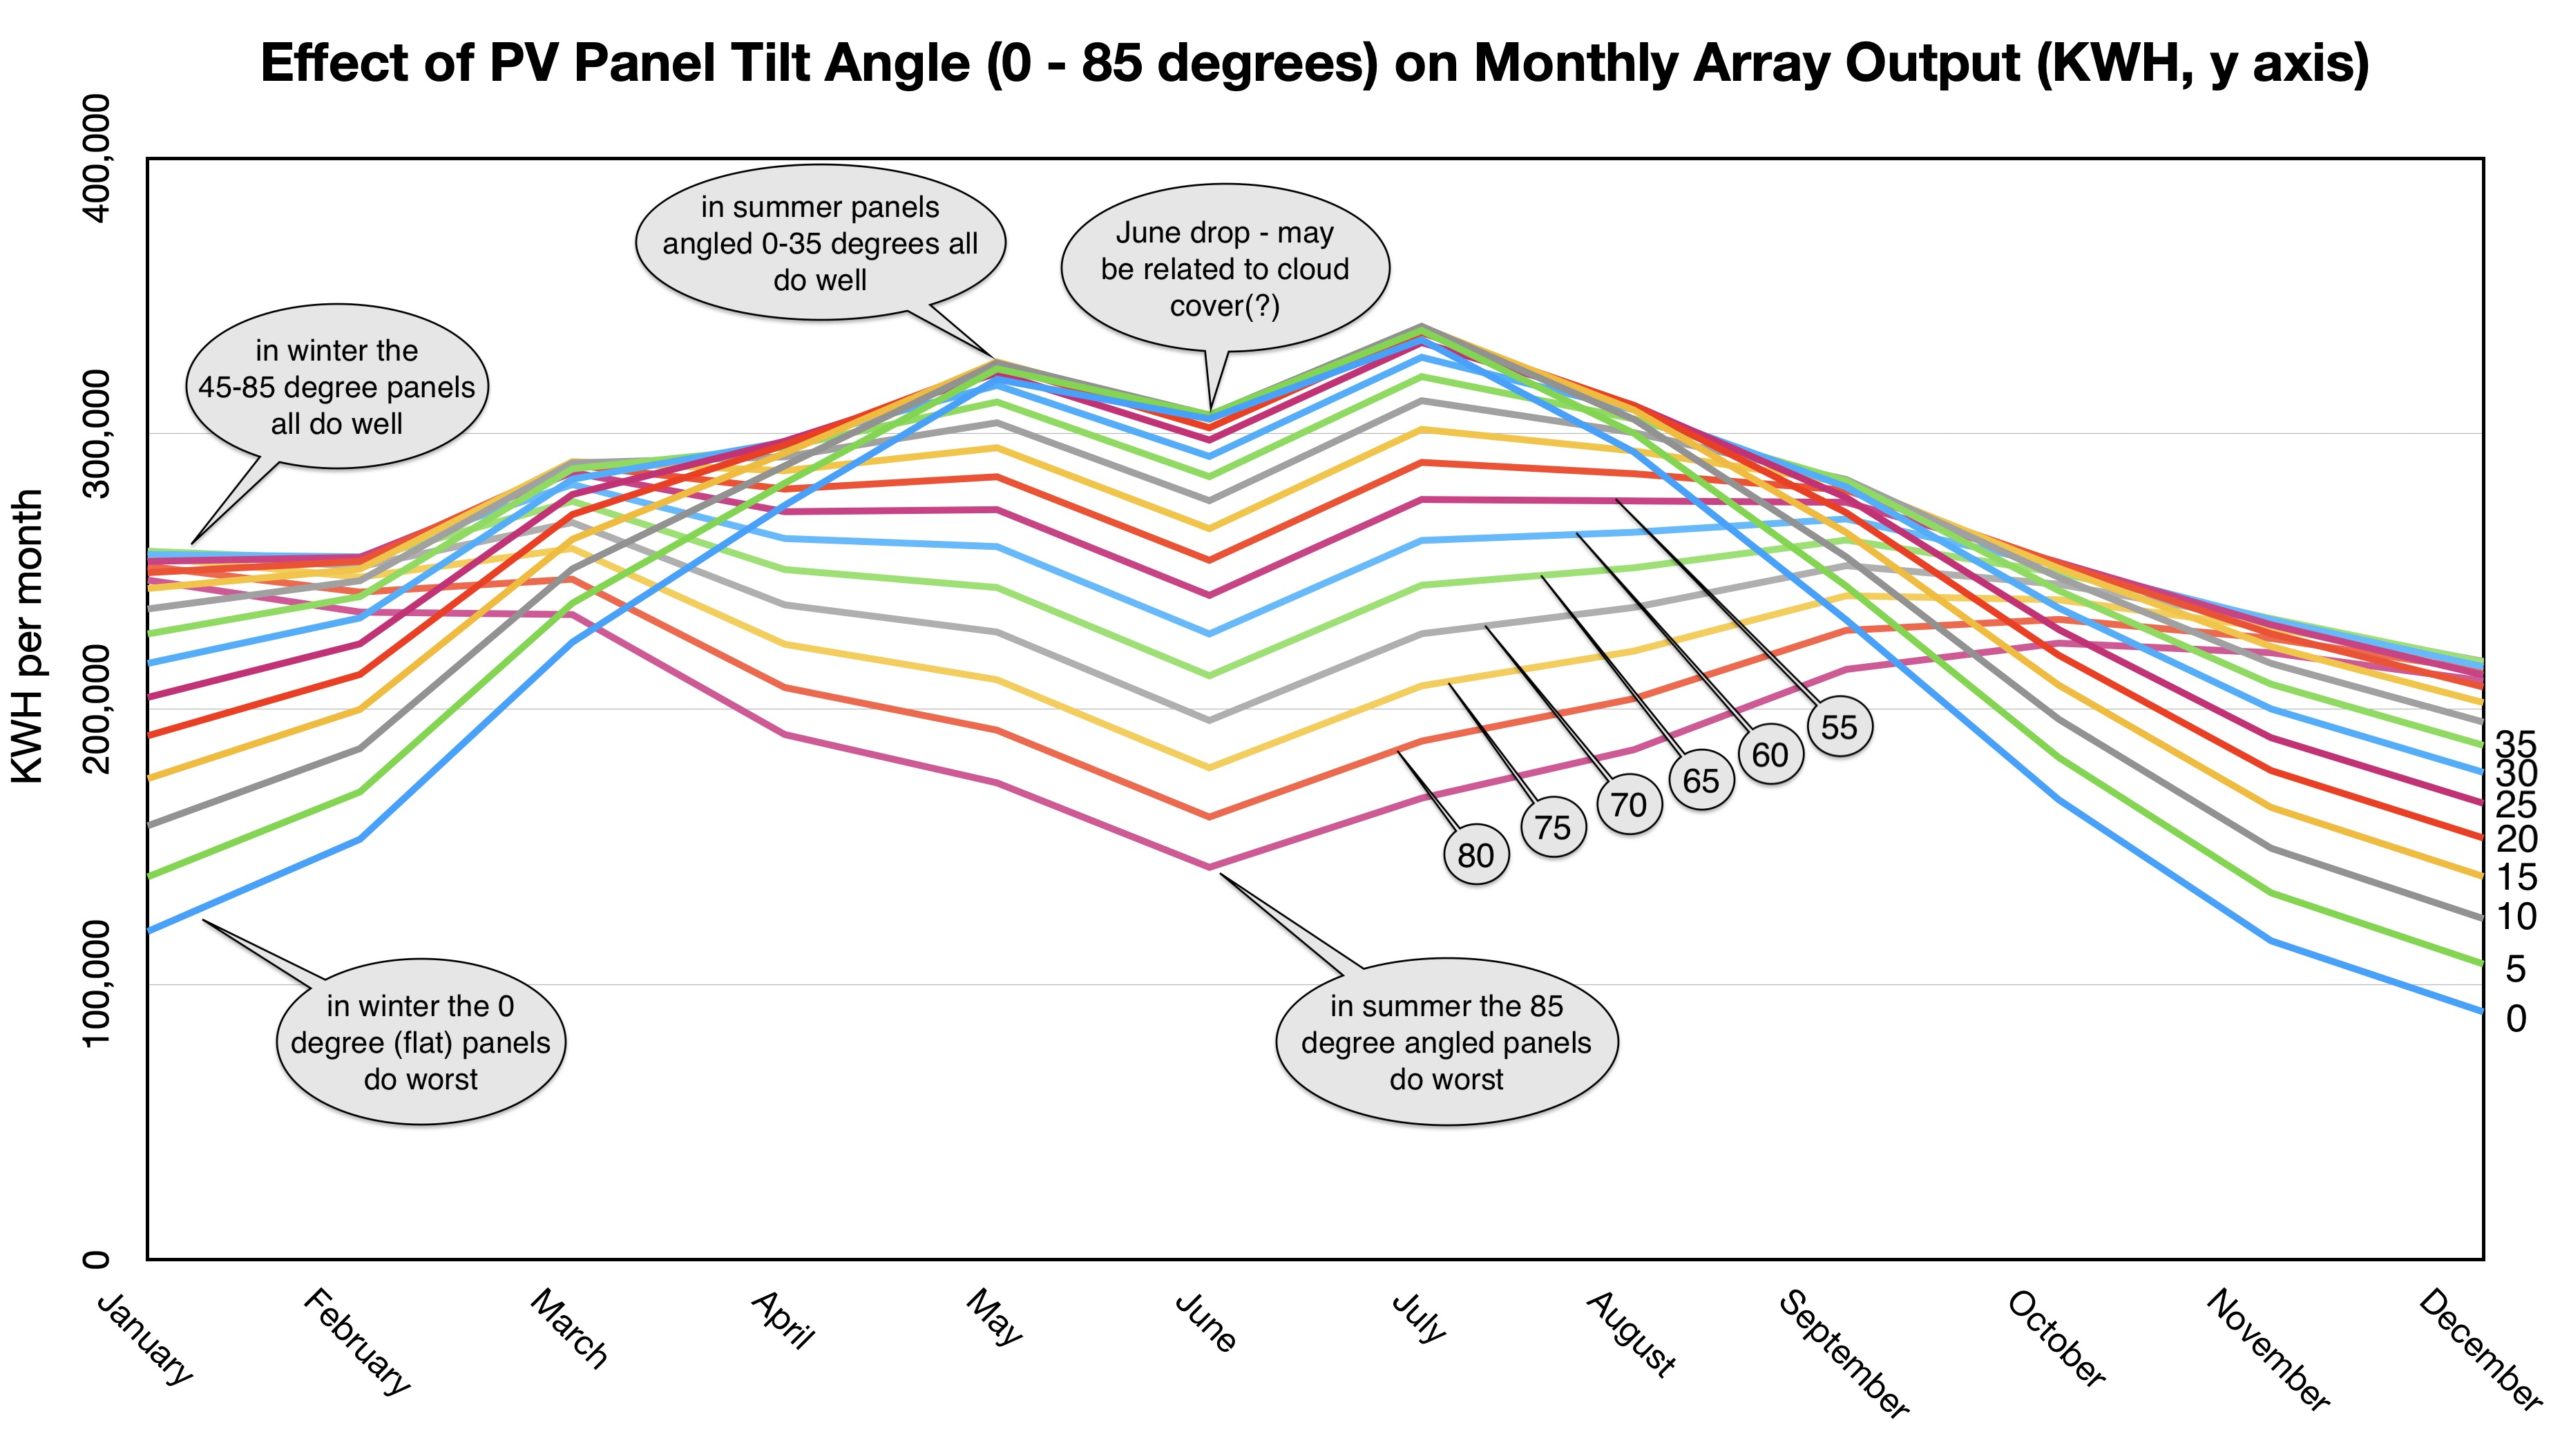
Fig. 4. Seasonal variation in electricity generated by a PV array in Belmont as a function of panel tilt angle, from 0 (flat to the ground) to 85 degrees (near vertical). The flat panels do best in summer when the sun is high in the sky (optimal angle from March to October: 25 to30 degrees ), while the more vertical panels do best in winter (optimal angle from November to February: 65 degrees). This figure highlights the potential advantages of changing panel angle in the spring and fall.
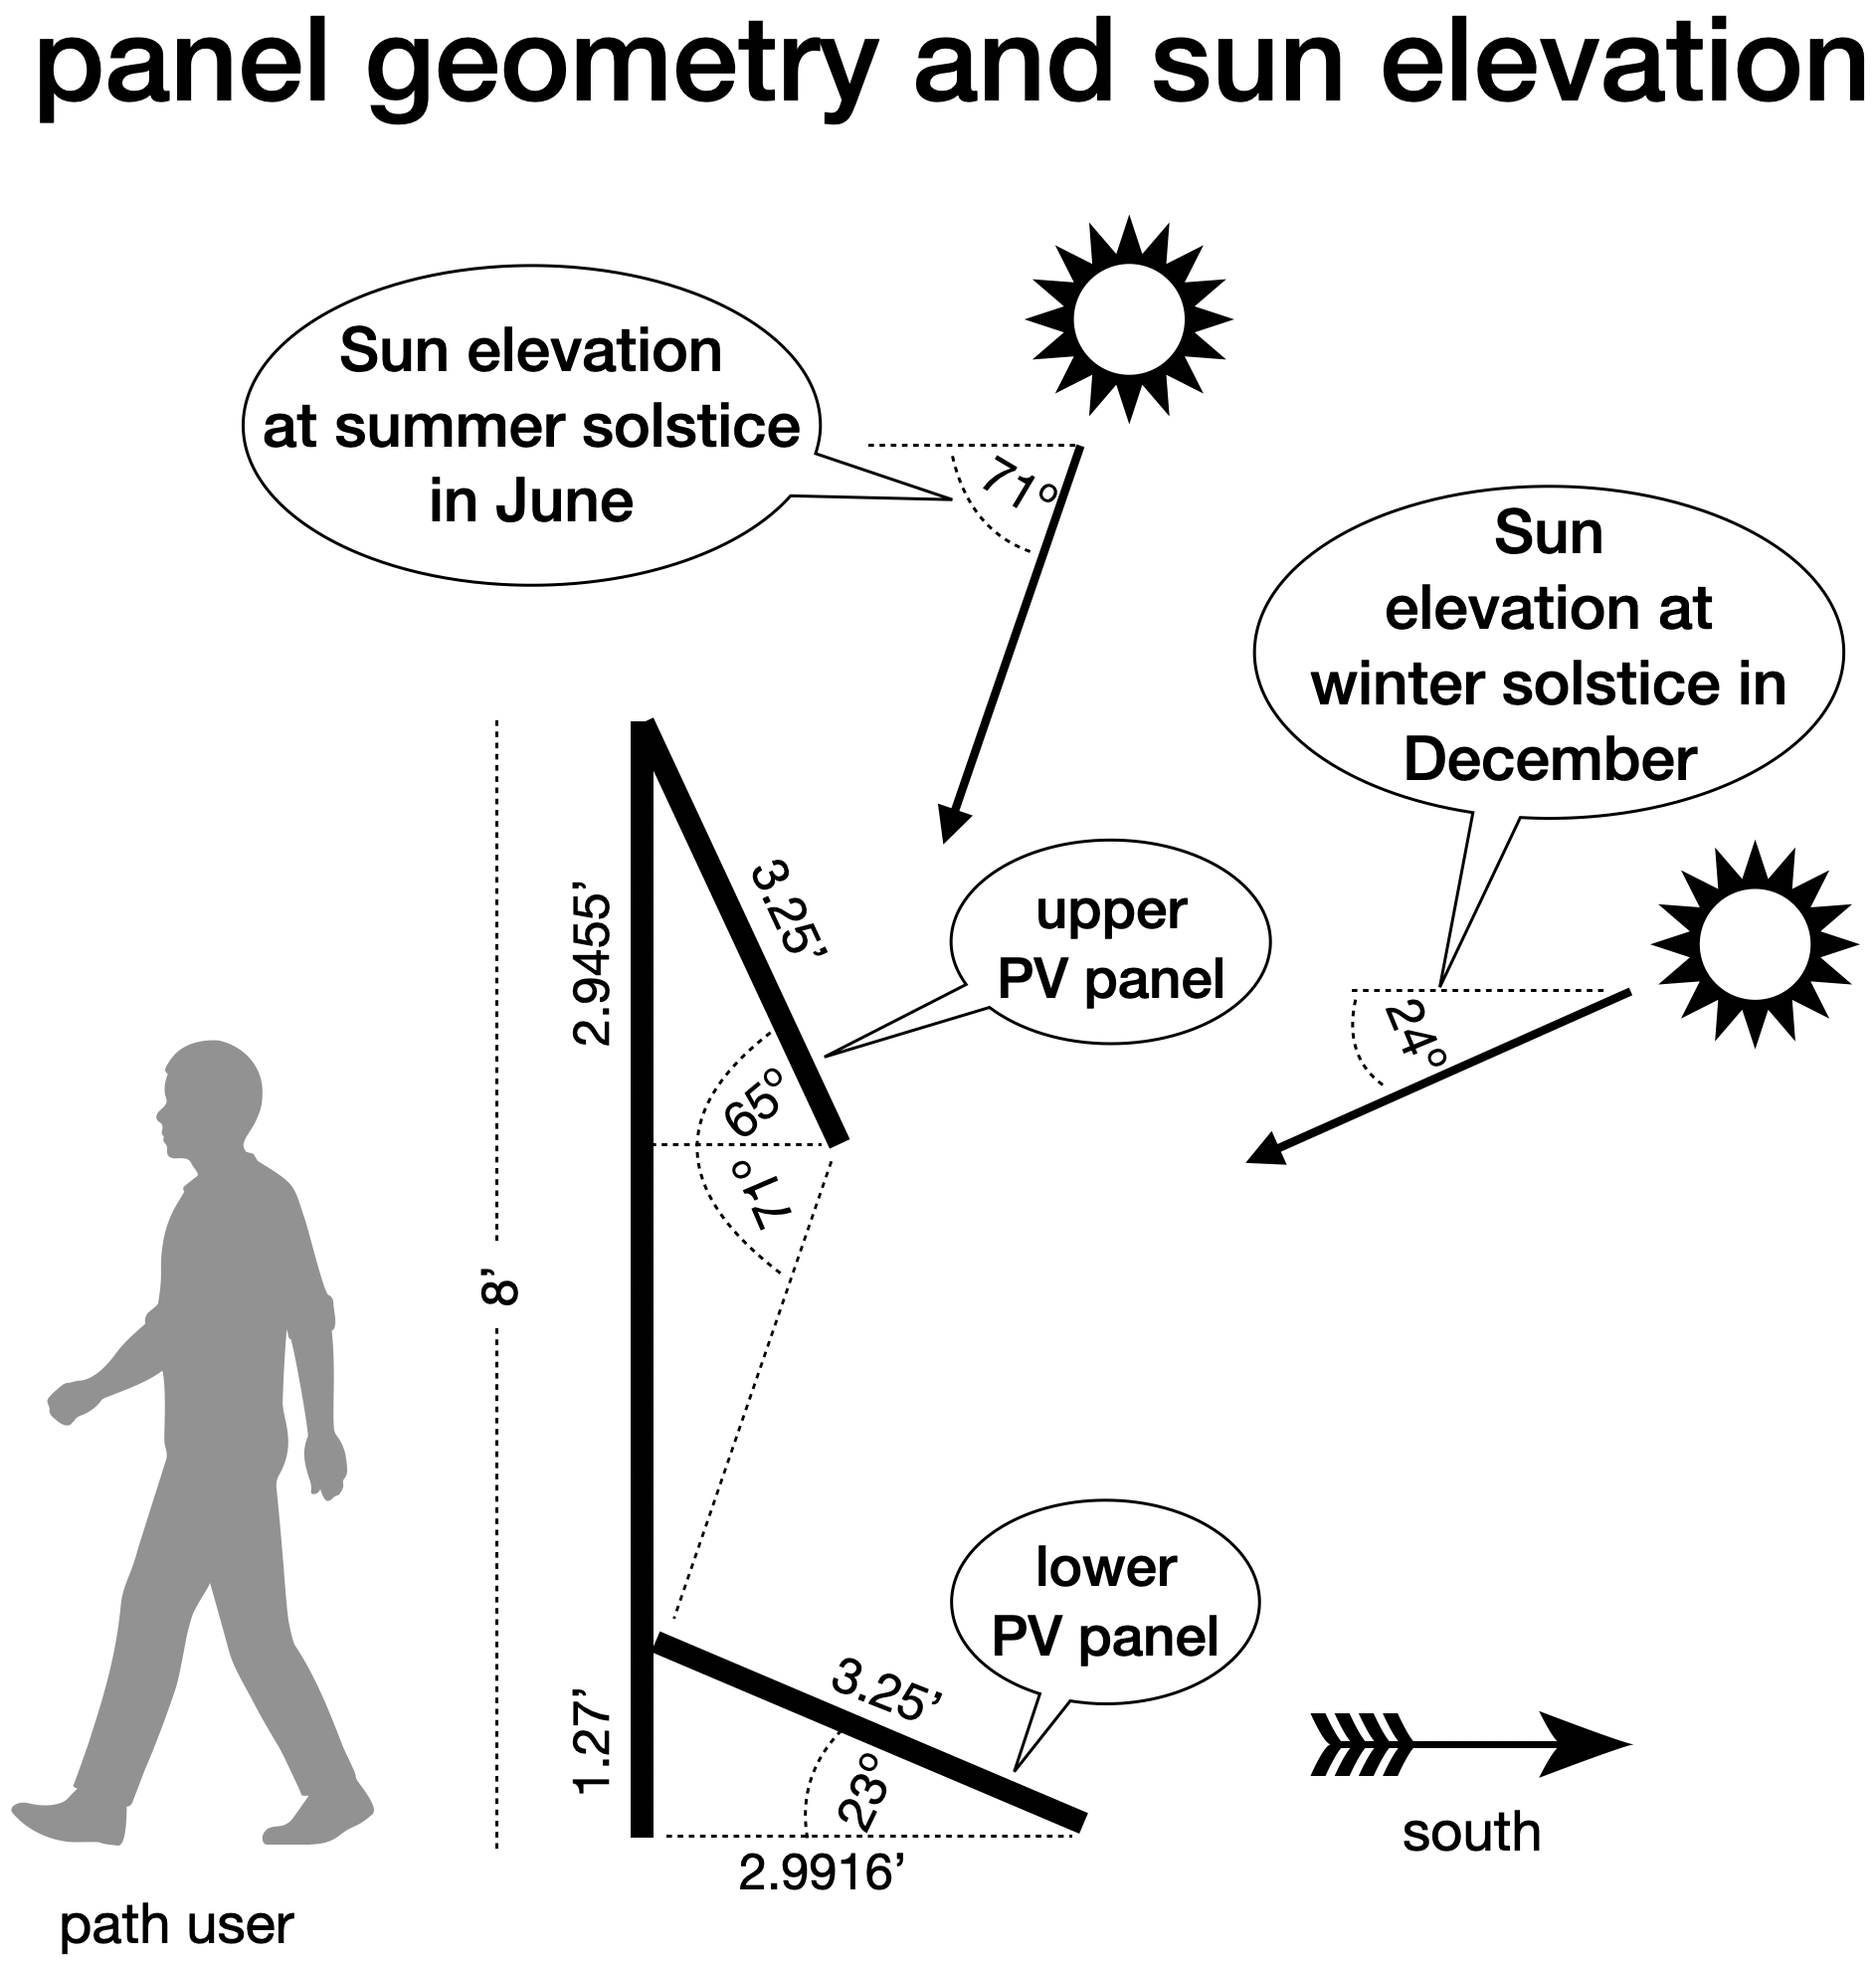
Fig. 5. PV panel arrangement on 8-foot fence, designed to avoid shadows at peak sun elevation (71 degrees at summer solstice). The upper panel is optimal for winter sun, the lower one for summer sun. The position of the lower panel could be adjusted in the winter (e.g., to 65 degreeso ) to increase energy production.
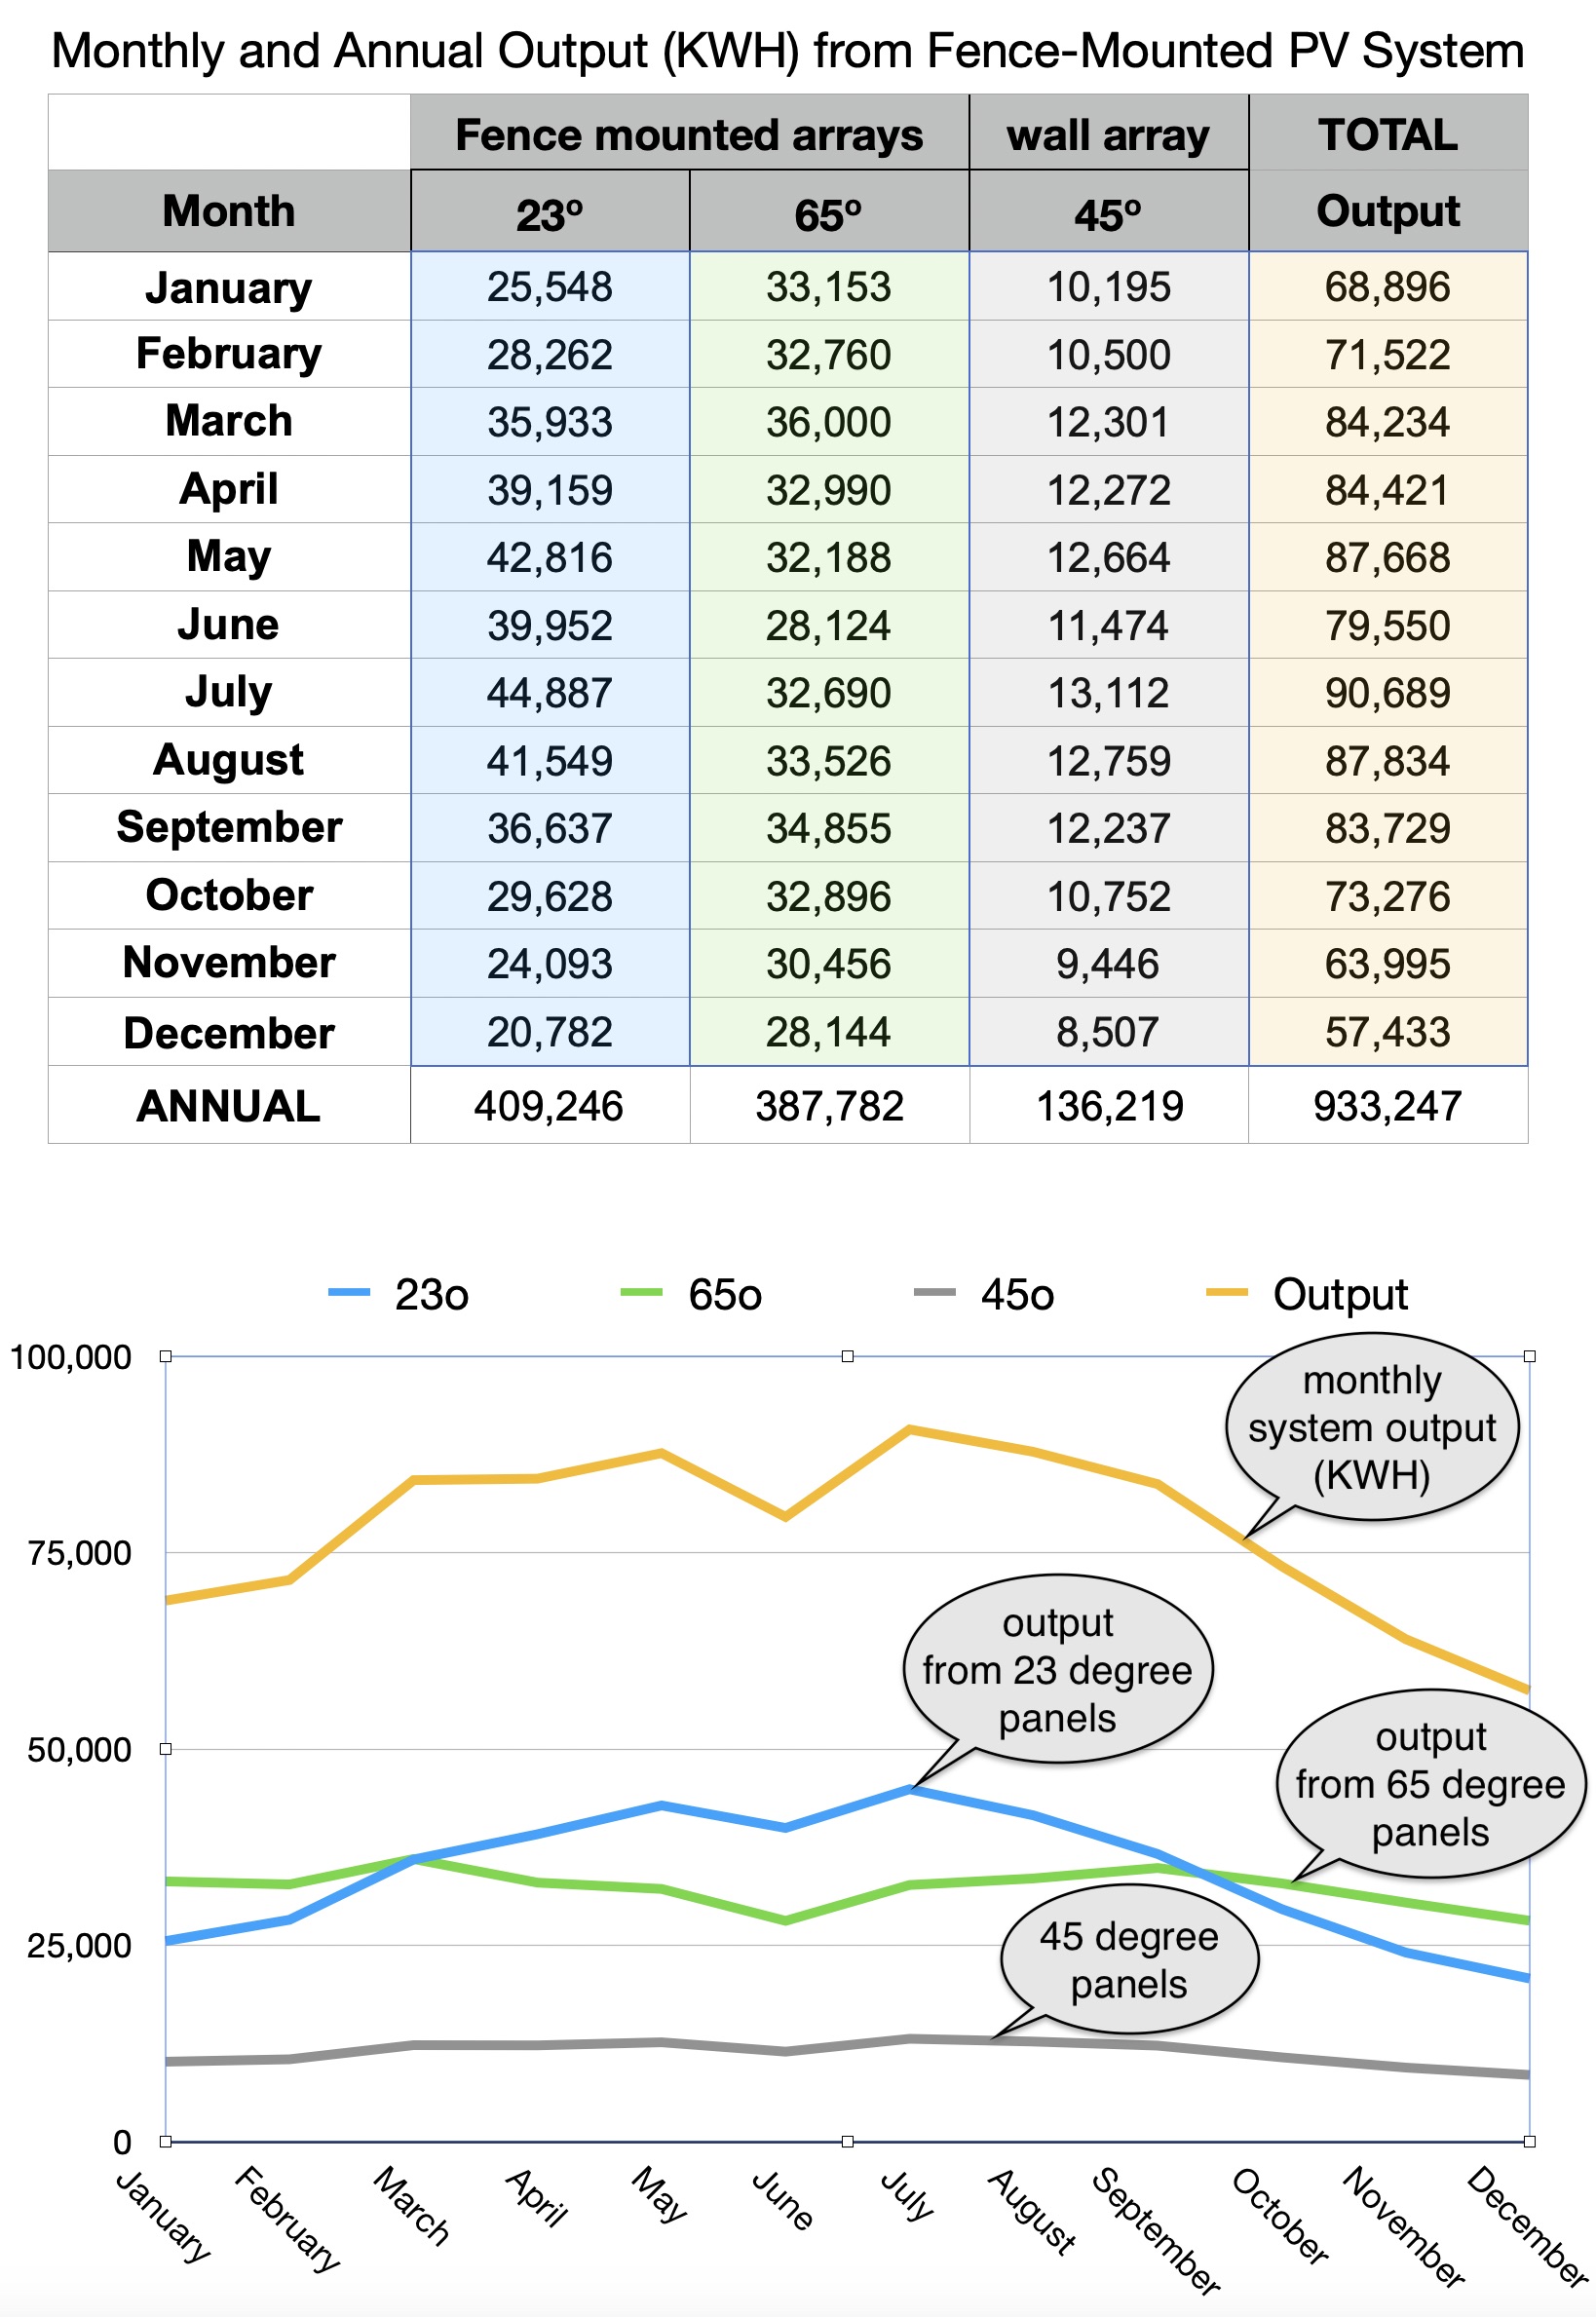
Fig. 6. Alternating current electricity output of a 2,334 PV panel array configured as in Fig. 5 (2,008 panels) or at a 45 degree angle (326 panels), with 19% efficient panels, as computed by PVWatts.
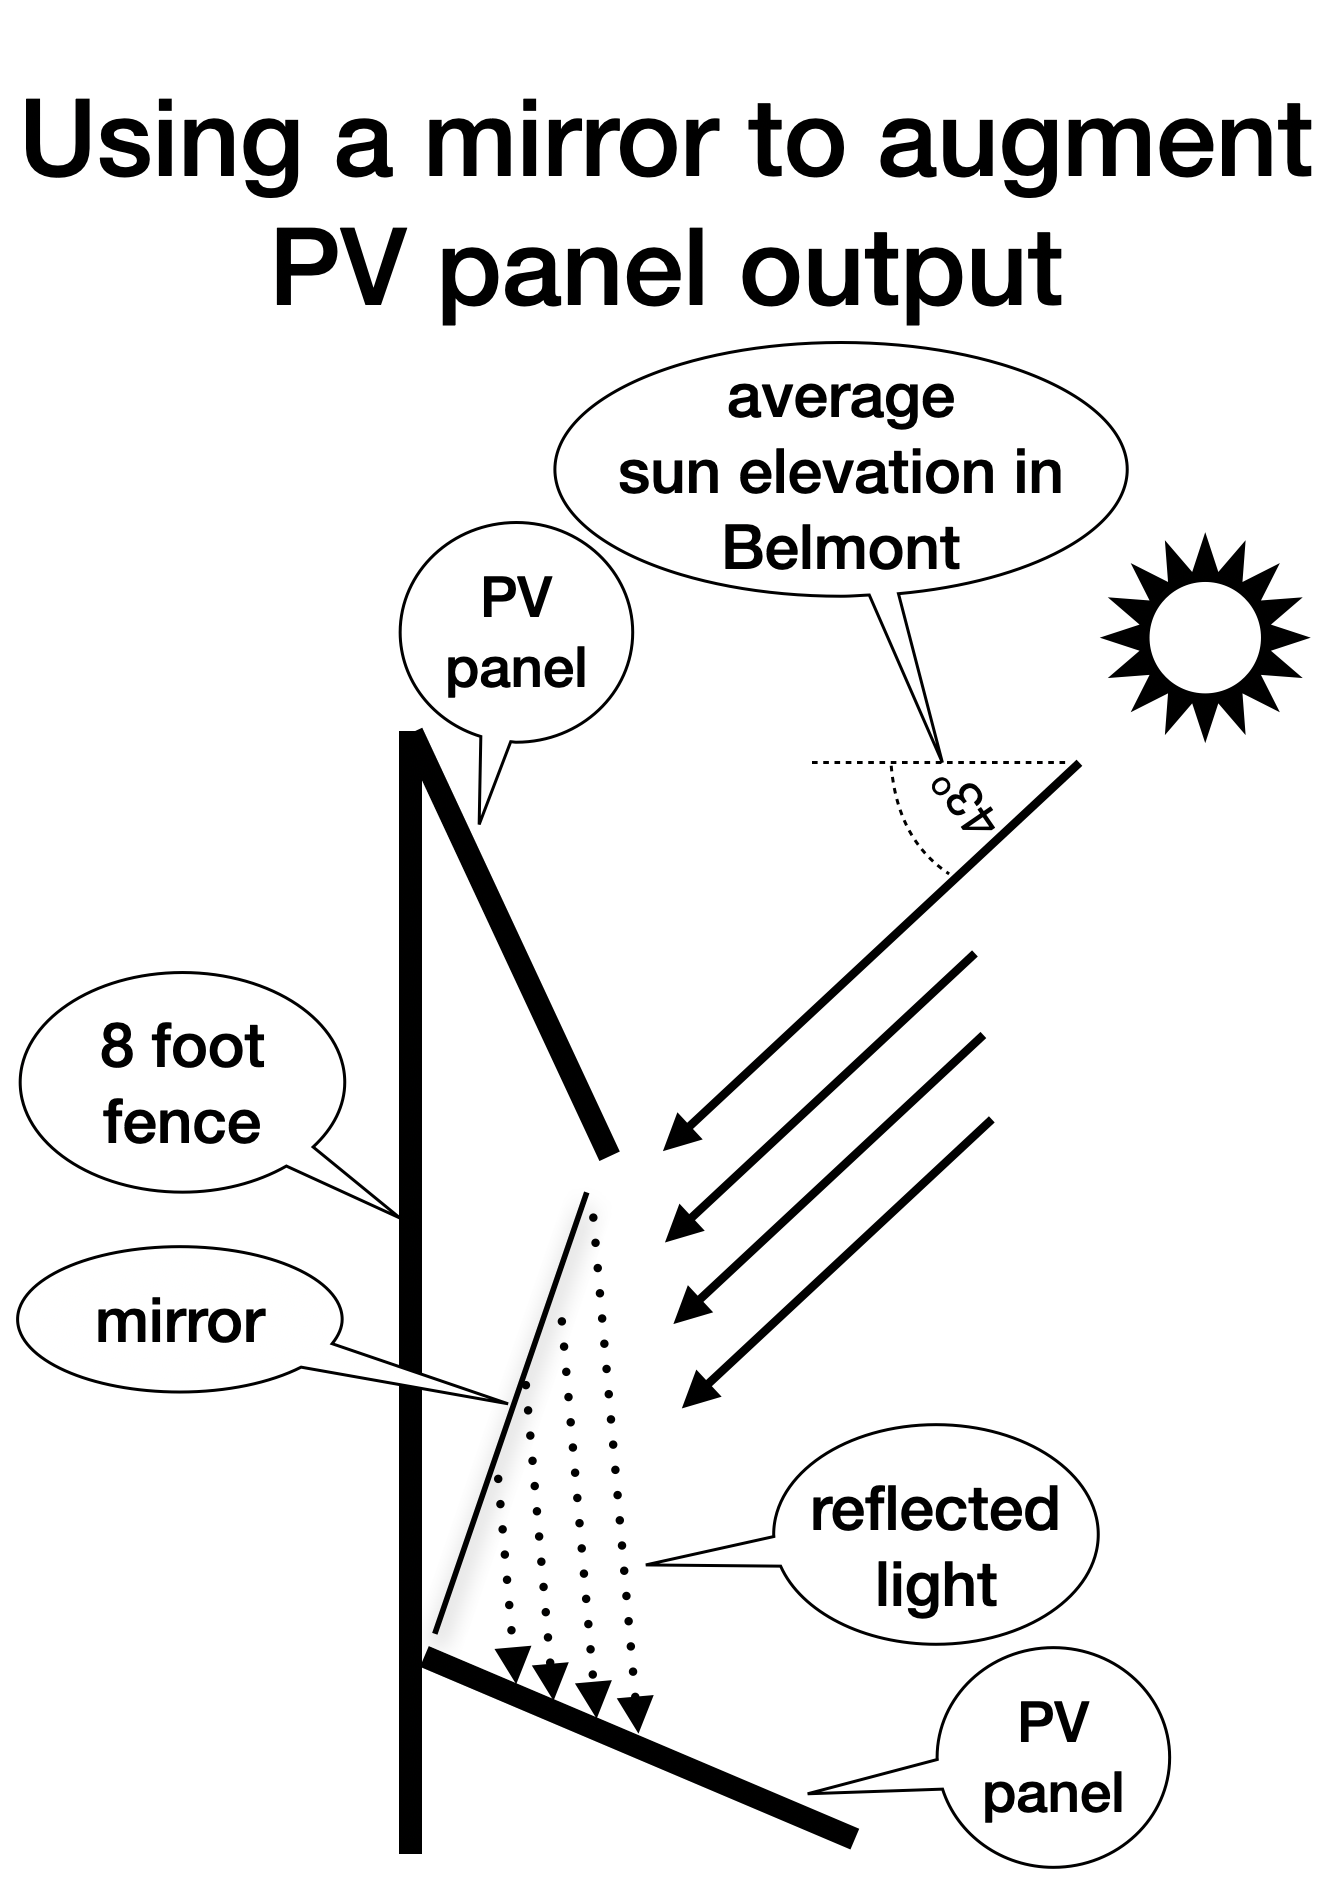
Fig. 7. Possible mirror placement to enhance output of fence-mounted PV array mainly during fall and winter months.
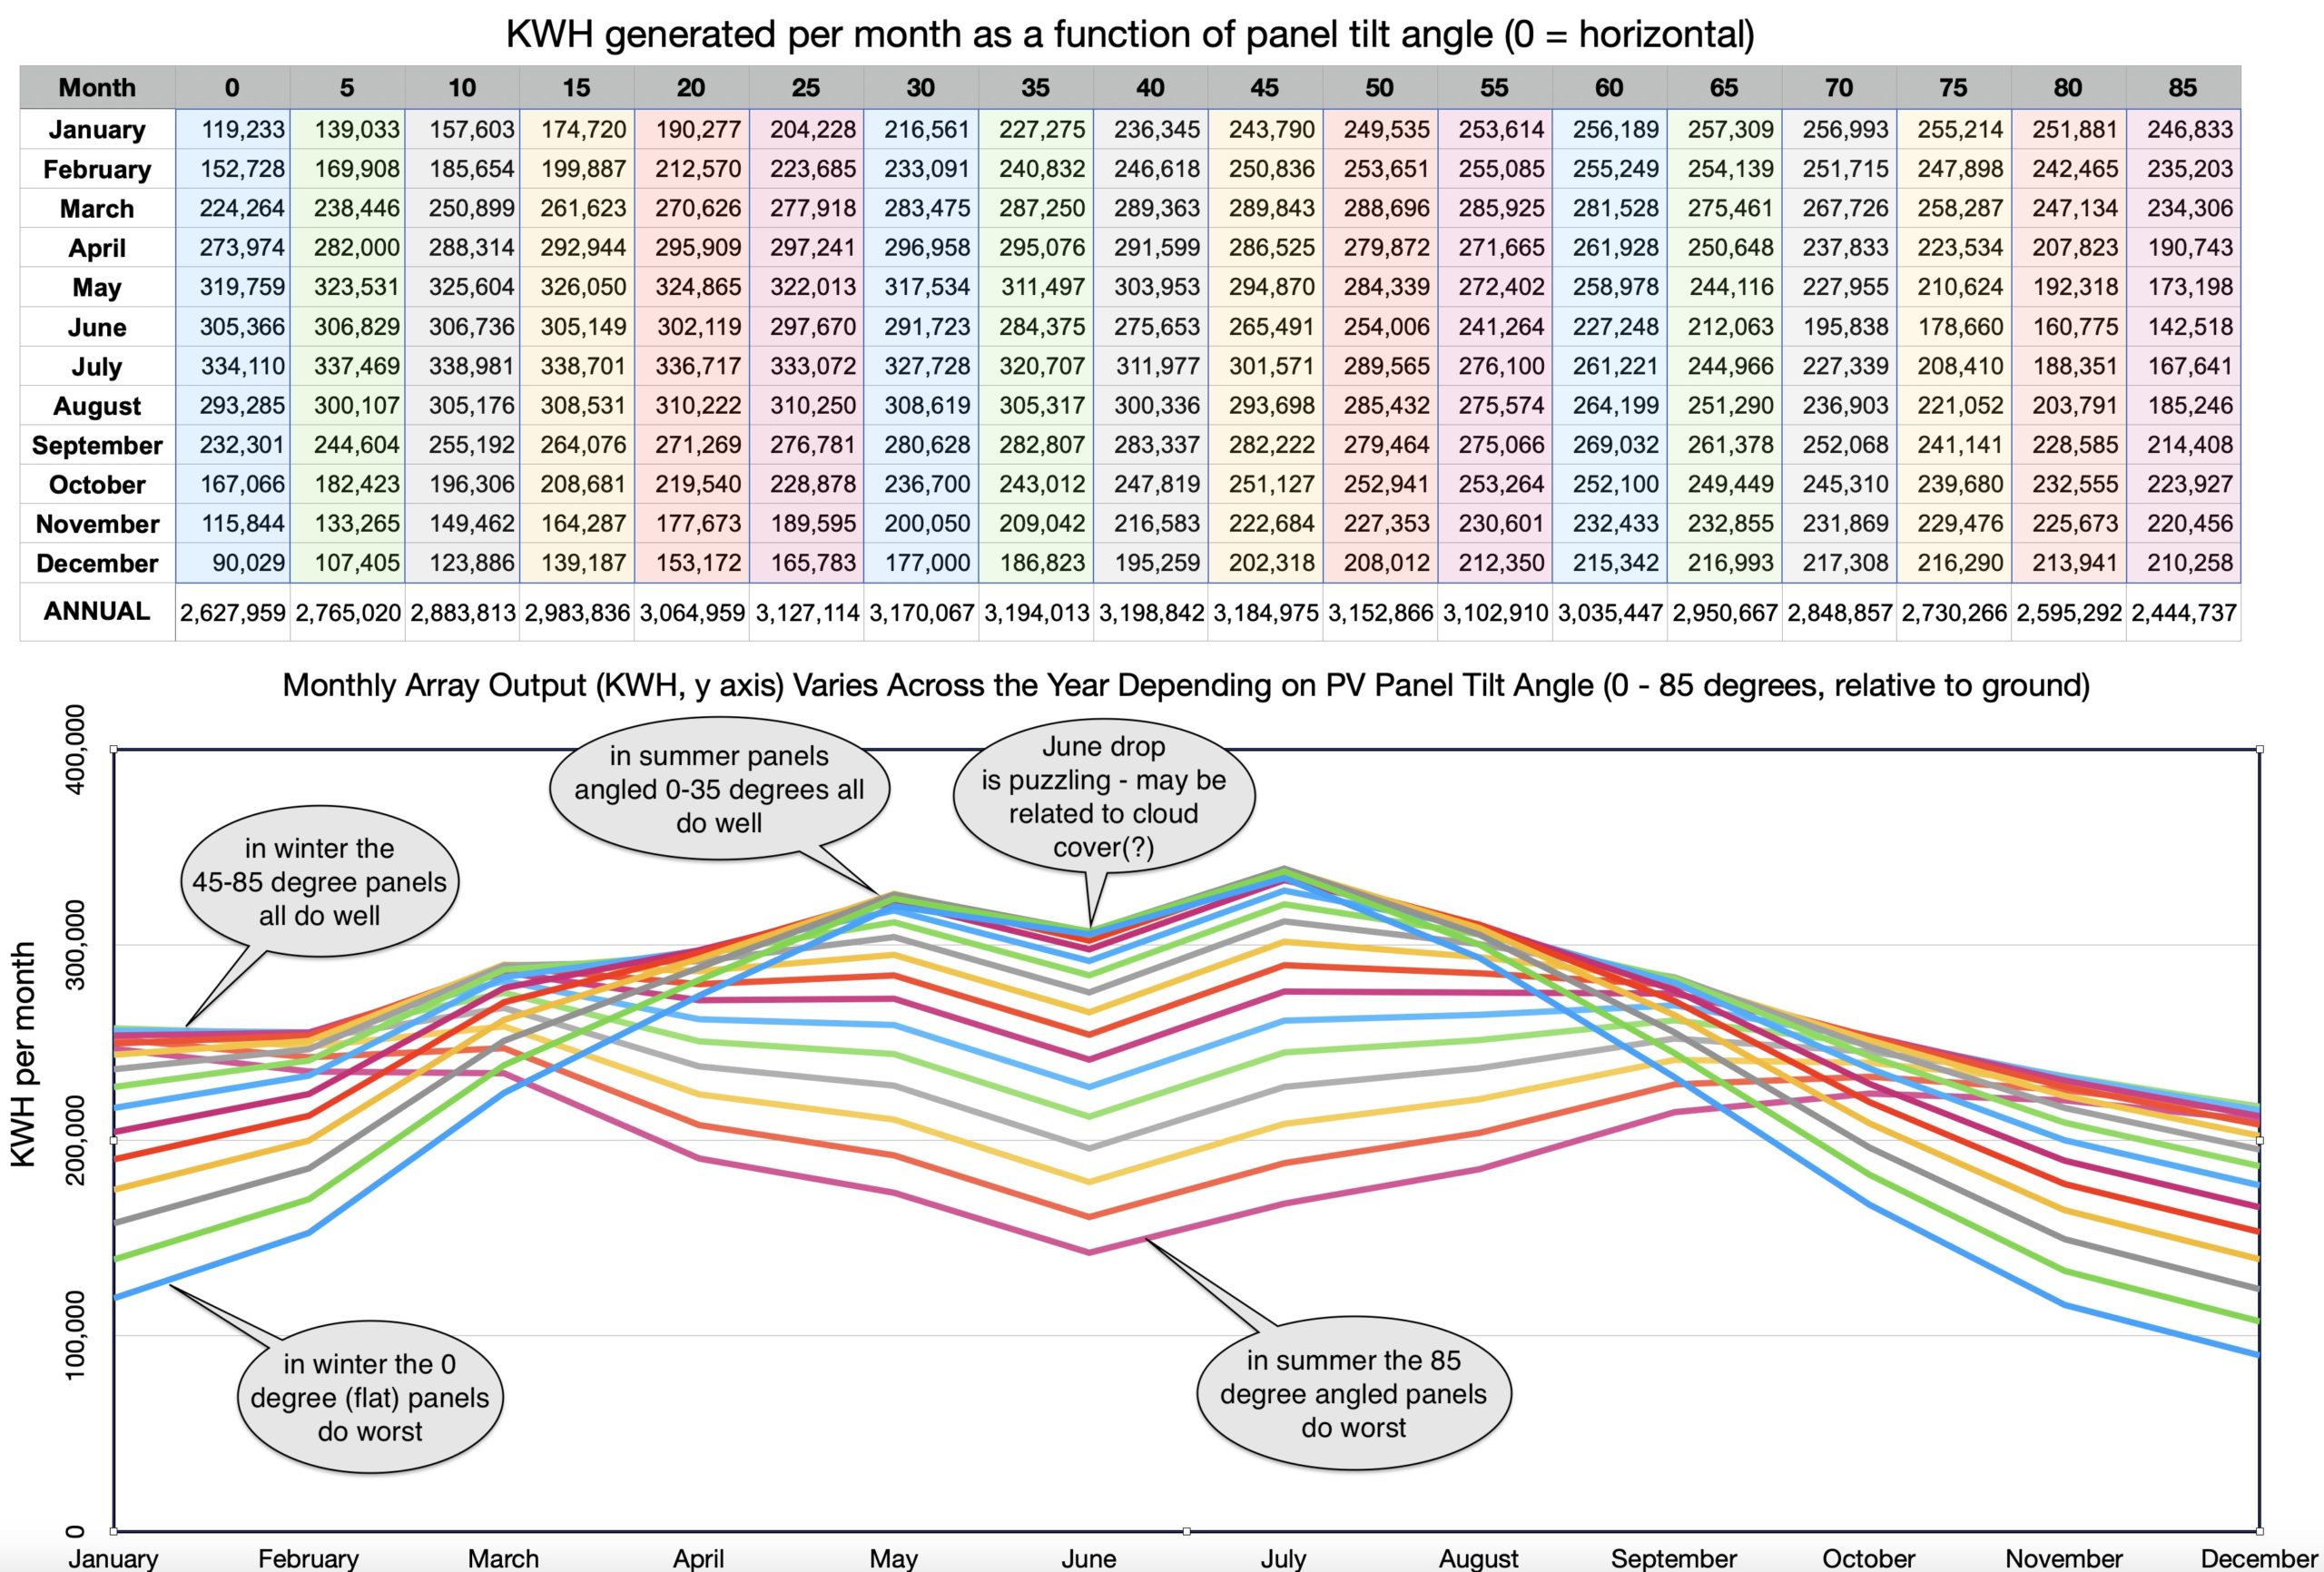
Fig. 8. Seasonal variation in electricity generated by a PV array in Belmont as a function of panel tilt angle, from 0 (flat to the ground) to 85 degrees (near vertical), with supporting data.
Fulfilling Belmont’s Climate Action Plan
In 2009, Belmont Town Meeting adopted a Climate Action Plan aimed at reducing greenhouse gas emissions 80% from 2007 levels by 2050. In 2010, the Select Board appointed an Energy Committee which has led a variety of successful local green initiatives including municipal building upgrades, a new building code, residential rooftop solar installations and PV electric cars. Belmont Light (BL) has installed “smart” electrical meters that collect data which can help optimize power use, set goals to decarbonize BL’s power portfolio, and offers a variety of customer incentives to encourage energy conservation and electrification.
In 2019, the Energy Committee, in its Climate Action Roadmap, acknowledged the progress outlined above, and more, but concluded “Belmont is not making nearly enough progress toward its climate goal.” As outlined in the Roadmap, the major contributors to greenhouse gas emissions in Belmont are transportation and heating, and the solution for both is electrification (electric vehicles and heat pumps).
A 29.6 KW PV array has just been installed on the roof of the Chenery School gym, and a 1,300 KW PV array is scheduled to be installed on the roof of the new Belmont middle-high school in 2023. Power from those installations is expected to exclusively serve the needs of the buildings on which they are mounted. Recently some Town Meeting members have pushed for a net-zero hockey rink. A Fitchburg Line PV array could help a project like the rink achieve net zero. The town is also considering a 1,000 KW array at the former incinerator site, at the corner of Mill and Concord.
PV solar next to live rail
India, England and Germany are among the countries building PV solar along train lines. Indian Railways (IR) in 2019 announced a plan to obtain one quarter of its electricity needs (5 GW) from PV solar by 2025, including 3.9 GW from trackside solar farms and 1.1 GW from the roofs of train stations and other IR-owned buildings, with an ultimate goal of 20 GW (net zero) by 2030. The PV solar installations are connected directly to the 15kV overhead traction system that powers the trains. IR also has installed customized rooftop PV panels on several hundred passenger coaches to power lights and fans.
In Aldershot, England a 30 kW pilot PV array was plugged into the British Rail traction power system in 2019; a larger array is now being connected via a second generation of the technology (see links at online version of this article).
In Germany the state-owned train system, Deutsche Bahn, is working towards meeting 80% of its electricity needs with renewables by 2030 and 100 percent by 2038. Currently, around 61% of the railway’s electricity comes from sustainable sources (mostly wind). Several PV projects are in development.
Adjusting azimuth and tilt angle to optimize solar PV efficiency
The optimal orientation for solar panels is perpendicular to the sun’s rays. However, that orientation is continually changing on daily and yearly cycles. At Belmont’s latitude (42.41 degrees), the optimum orientation for a fixed panel (such as would be mounted on a roof) is south facing and tilted up 42° from horizontal (however varying the angle from 30° to 45° produces within 1% of the power of 42°). That represents a compromise between the optimal summer and winter positions. If the panels were repositioned during the year more energy could be captured. For example if adjusted twice a year the optimal orientations would be 25-30° in the summer (when the sun is high in the sky) and 65° in the winter. Four season repositioning would capture even more energy, with panels angled at elevations of 21° in summer, 51° in fall, 64° in winter, and 33° in spring.
Even more efficient energy capture can be effected by continuously moving panels to face the sun throughout the day via a motor. There are two versions of this technology: moving the panels in one plane, to follow the sun across the sky from east to west, or moving the panels in two planes, to also capture the rise and fall of the sun’s elevation throughout the day. As a rule of thumb the biggest payoff is from horizontal tracking which can increase system output by 25-35%, while dual-axis tracking can yield 35-40% more power. These two technologies are generally confined to industrial scale solar installations (1 MW or greater).
PV panel efficiency
Standard commercial-size PV panels (6.5 x 3.25 feet) are 15-20% efficient (i.e. they convert 15-20% of the incoming sunlight into electricity) and are typically rated at a nominal 300-330 watts. High efficiency panels, which cost more, approach 23% efficiency and can produce 375-425 watts.
Annotated bibliography
Belmont
Belmont Community Path
The 25% design drawings for the Belmont Community Path (submitted to MassDOT in November 2021) can be accessed at the project website, maintained by Nitsch Engineering.
https://belmontcommunitypath.com
The layout and dimensions of the Fitchburg Cutoff Path (a part of the Belmont Community Path) are shown in 2008 Land Plan 975, accessible from the website of the Middlesex Registry of Deeds, Southern District.
https://www.masslandrecords.com/MiddlesexSouth/default.aspx?AspxAutoDetectCookieSupport=1
Belmont Energy Committee
Belmont Energy Committee website
https://belmontclimateaction.org/
Belmont Climate Action Roadmap: A Belmont Roadmap for Strategic Decarbonization
Massachusetts
Massachusetts energy policy
Governor Baker signs Senate Bill 9 into law: “An Act Creating a Next Generation Roadmap for Massachusetts Climate Policy” commits the Commonwealth to Net Zero emissions by 2050.
MBTA
MBTA decarbonization goals for the commuter rail system
“Greening the Fleet: Decarbonizing the MBTA”
https://www.mbta.com/sustainability/greening-the-fleet-decarbonizing-the-mbta
MBTA Rail Vision Report – 2020
www.mbta.com/projects/rail-vision#alternatives
TransitMatters report on electrification of the MBTA commuter rail network – 2021
MBTA solar PV arrays
MBTA completes installation of PV on 37 stations and parking lots; sells electricity from parking lot PV arrays in Hingham to Hingham Electric, a municipal utility like Belmont Light
https://www.mass.gov/doc/mbta-solar-canopy-green-energy/download
Massachusetts municipally owned utilities
Green initiatives by Massachusetts Municipally owned utilities are summarized in the Metropolitan Area Planning Council’s 2016 report “Municipal Light Plants in Massachusetts: Spotlight on Clean Energy Initiatives”
https://www.mapc.org/wp-content/uploads/2017/10/MAPC_MLPWhitePaper_Jul2016.pdf
Sterling Municipal Light Department (SMLD)
SMLD installed a $2.5 million battery storage system in 2016. The cost was partly defrayed by a $1.46 million grant from the Massachusetts Department of Energy Resources and partly by a $250,000 grant from the U.S. Department of Energy.
Hingham Electric
Energy Storage Procurement Guidance Document for Municipalities
Written by scientists, engineers and regulatory experts at Sandia National Laboratory. This document was used by Sterling in its battery design, purchase and installation
International efforts to directly power rail with PV solar
India
Indian Railways (IR), which consumes 2.4% of all electricity in India, plans to install 20 GW of solar generation capacity to reach net-zero operations by the end of this decade.
Study shows that IR can more efficiently produce renewable energy on its own property than by purchasing it on the market.
Rooftop PV on Indian Railways passenger coaches
England
Pilot study demonstrates railside PV electricity fed directly into railroad traction stations (as direct current, via a third rail) to move trains
Follow-on project using the same technology on a larger scale, partnering with Network Rail, the infrastructure operator for the national train system, the UK’s largest electricity consumer.
Germany
Deutsche Bahn, the state-owned train system, is working towards meeting 80% of its electricity needs with renewables by 2030 and 100 percent by 2038. Currently, around 61% of the railway’s electricity comes from sustainable sources (mostly wind).
https://www.cleanenergywire.org/news/rwe-supply-german-rail-company-additional-north-sea-wind-power
Germany’s TÜV Rheinland is investigating how PV could be used to power its rail system.
https://www.pv-magazine.com/2021/12/21/solar-for-railways/
Emerging PV solar technologies
Bifacial solar panels
Overview of recent developments
https://news.energysage.com/bifacial-solar-panels-what-you-need-to-know/
Describes an array combining bifacial panels and solar tracking; includes an interview with an executive from LONGi Solar, a leading producer of bifacial panels.
Booster reflectors – using mirrors to reflect extra light onto PV panels
Among the reasons mirrors are not more widely used: panel prices have gotten ever cheaper, and there has been concern about shortening panel life by increasing solar irradiation (and possibly voiding panel warranties). This article cites both field measurements and simulations. to dismiss that concern, while estimating the potential of mirrors to increase output.
Scholarly article by the same researcher:

Sorry, the comment form is closed at this time.