By Sumner Brown
Stormwater can be troublesome. Those drops of water add up, causing floods, overflowing sewers, and reduced water quality. Belmont is striving to remedy its stormwater problems, and we need to monitor the effects and measure the results.
Water Flow in Alewife Brook
Rain falls on the ground and finds its way into streams. We can measure the overflow from rainstorms by placing flow gauges where major streams leave Belmont, So far Belmont has only one such stream flow gauge, in Alewife Brook. The gauge is operated by the US Geologic Survey. It is shared with Arlington, Somerville and Cambridge and located in Arlington on the north (downstream) side of the Broadway Street bridge over Alewife Brook, close to the Somerville border.
In operation the gauge simply measures the height of the water, using electronics similar to those that automatically focus cameras. The water height is associated with measured flow through an initial calibration, by manually measuring water velocity at multiple locations and rates of flow across the stream. Data has been collected at this site since 2005 and is available online.
Will Brownsberger, who was instrumental in getting the current gauge in 2007, remembers the cost was about $20,000. However, maintaining the gauge is expensive because it requires periodic recalibration; for example, whenever debris like a shopping cart gets thrown into the stream in the vicinity of the gauge.
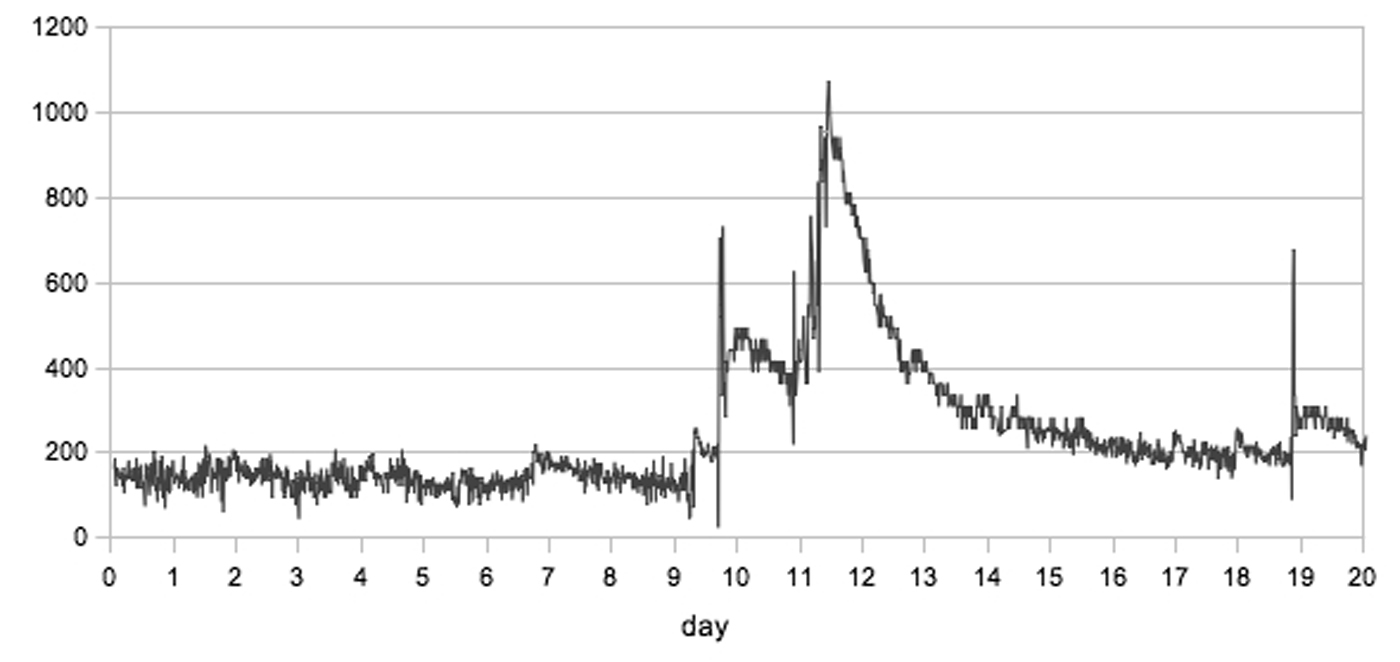
Figure 1 shows data from the Alewife Brook gauge for the period May 22 – June 10, 2015. The flow was nearly constant, at 6 cubic feet of water per second, until May 31, when Figure 2 shows there were three days of rain.
To put water flow into familiar terms, in Belmont each person uses about 64 gallons of tap water per day, down from 70 gallons in 2008. (Check your water bill to compare your own use.)
The Massachusetts Water Resource Authority (MWRA) counted 24,537 people in Belmont connected to their sewer system in 2013. Hence Alewife Brook’s normal water flow of 6 cubic feet per second, as measured, equals about 158 gallons per day per Belmont resident, or about double the average resident water consumption that is discarded as sanitary sewer flow.
By measuring stream flow over a few years, we could compare the flows after similar storms, and together with rainfall data, can judge whether our stormwater efforts are working, especially in respect to the new developments at the Belmont Uplands.
How much rainwater falls on Belmont? Put an empty can outside and you have a rain gauge. If you place the gauge away from trees and buildings and automatically record rainfall every hour, then you have a great gauge.
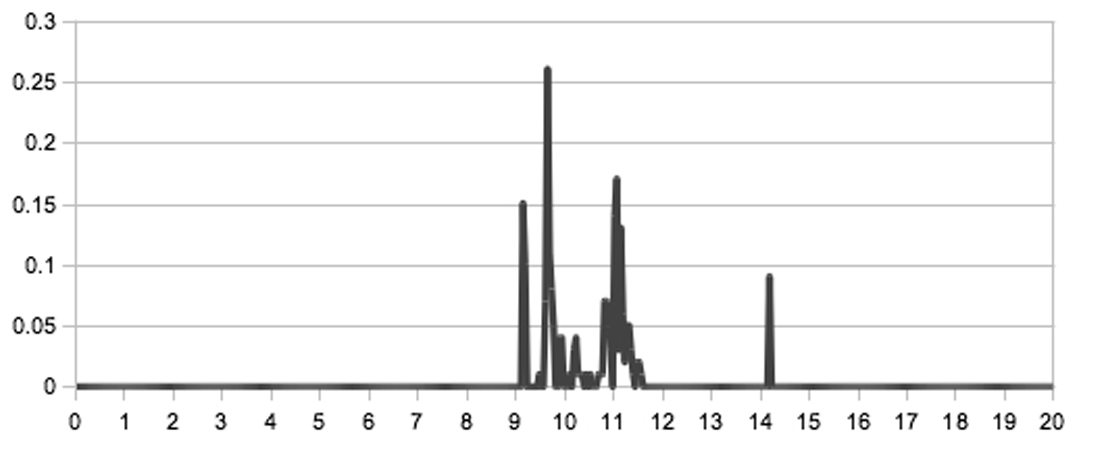
Figure 2 shows data from the rain gauge at Logan Airport. No surprise, when it rains, the flow in Alewife Brook increases. (Local thunderstorms may make Belmont rainfall different from Boston, 8 miles away.) Data from the Logan gauge is available online as well.
Notice that there is not much delay between rain and Alewife Brook flow. This fast response is largely man-made, and potentially damaging. Belmont and Arlington have built houses in an area that 17th-century colonists called “The Great Swamp.” Our paved roads send water rapidly via storm drains into the streams. While swamps are now known as wetlands, and environmental laws prohibit developing swamps, the urban development remains.
Rain gardens reduce rapid runoff, as does permeable pavement that lets water flow into the ground below. Both increase desirable groundwater levels; they reduce peak flows in streams and hence reduce flooding, while increasing dry weather flow (see “Rain Gardens Turn Stormwater Into Flowers,” Belmont Citizens Forum Newsletter, May/June 2011.)
Stormwater Quality
Stormwater quality measurements mostly focus on avoiding the types of bacteria found in sewage. The state sets bacteria-based water quality requirements for domestic water supply systems, for swimming, and for recreation such as boating. Water quality in streams and ponds is measured by taking water samples, which are sent to a laboratory for analysis.
The presence of bacteria in stormwater indicates problems with sewer lines and sewer laterals, which are the pipes that link homes to city-owned sewer lines. Leaking sewer pipes cause stormwater contamination that permeable driveways and rain gardens will not fix.
The municipality maintains the sewer lines, but laterals are the responsibility of homeowners. Fixing a lateral may cost $5,000 if only relining is needed. Or it could cost twice that or more if digging is involved. Such costs will not be popular with homeowners, but requiring homeowners to inspect and repair their laterals as part of real estate sales may seem more reasonable. Newton Aldermen Ruthanne Fuller and Deb Crossley are working to make fixing laterals a state requirement.
The Environmental Protection Agency (EPA) may choose to specify other measures of stormwater quality. The EPA’s 2010 draft stormwater regulations, not yet in force, would make Belmont responsible for limiting phosphorus in streams flowing into the Charles River. Phosphorus sources include fertilizer-laden stormwater runoff from golf courses and homes that grow beautiful grass. Such runoff can be mitigated; for example, the constructed wetlands at Alewife are designed to remove phosphorous and other nutrients from stormwater runoff by letting the stormwater flow (slowly) through plant roots. Sewage processing plants remove phosphorus by using microbes to transform dissolved phosphorous into biological solids. Those solids precipitate out of solution, fall to the bottom of a tank, and are collected and removed.
Stormwater in Sanitary Sewers
During big storms, an influx of stormwater into sanitary sewers can cause sewer overflow into basements, and sometimes onto streets. Since the Winn Brook neighborhood system with sewage holding tanks came online in April, 2011, there have been no basement floods in Winn Brook. However, other sanitary sewers have overflowed along the route between Belmont to Deer Island.
Stormwater gets into sanitary sewers by two routes. As groundwater it enters through leaks in the sewer pipes. This is called infiltration. Fixing laterals may be needed to substantially reduce this component. Stormwater also gets in because of illegal sewer use, or sump pumps and rain gutter down spouts that should not be connected to sanitary sewers. This is called inflow. Such connections are illegal, but Belmont does not vigorously enforce this. The Massachusetts Water Resource Authority (MWRA) estimates that in 2013 Belmont’s infiltration was 30% of average total flow and inflow was another 11%.
The MWRA estimates our inflow and infiltration by measuring the flow at the two locations where Belmont’s sewer lines enter the MWRA system. Figure 3 shows Belmont’s sanitary sewer flow data for the period May 22–June 10, 2015. In 2013 Belmont’s average sewer flow was 2.7 million gallons per day, or 110 gallons per day per person. If you cannot imagine using that much water, you are right. We average about 64 gallons per day of water. The rest is inflow and infiltration.
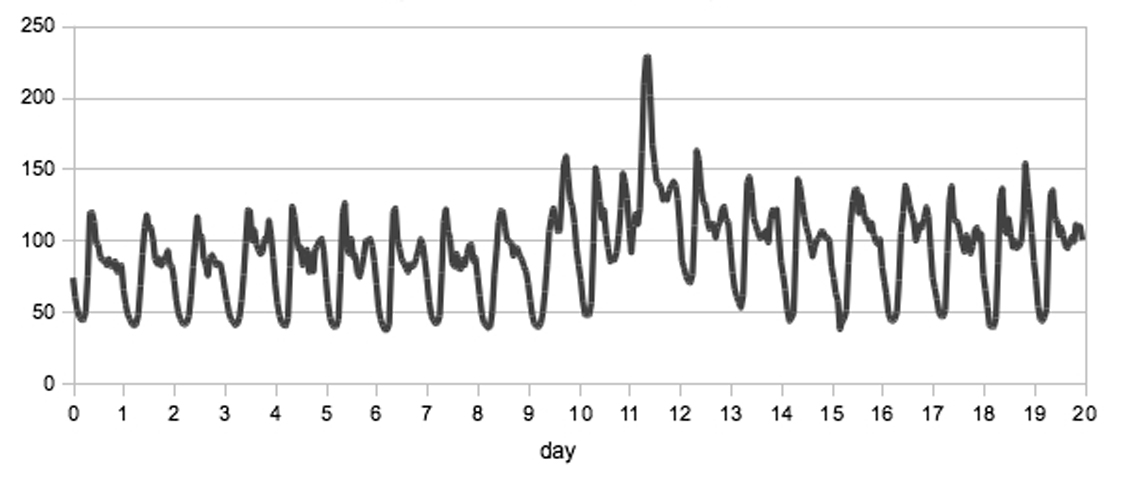
Figure 3 data until May 31 shows that normal sewage flow follows a regular daily pattern. At 4AM very little water is used, while by6 AM people are getting ready for work and school. This regularity allows the MWRA to estimate the amount of stormwater in our sewers.
When there is no rain for weeks, both inflow and infiltration go down in the absence of stormwater being pumped into the sewers, and there isn’t as much groundwater to flow in.
When it rains, inflow will increase and decrease more rapidly then infiltration because inflow is doesn’t have to flow through earth to get into sanitary sewers. Inflow rushes straight in from illegal storm sewer connections; infiltration has to seep in through pipe cracks.
Of the 43 towns in the MWRA sewage treatment community, 41 send sewage to the Deer Island processing plant. Belmont’s inflow and infiltration problems are typical. No town has solved this problem despite millions of dollars being spent to try to reduce inflow and infiltration.
For 2014 the total rainfall at Logan was 47 inches. Belmont is 4.6 square miles and has a total population of about 25,000. So Belmont received about 3.8 billion gallons of rain, or 415 gallons per person per day. Household use is about 64 gallons of water per person per day from the Quabbin Reservoir (besides irrigation and swimming pools). Belmont’s inflow and infiltration averaged 45 gallons per person per day, or about 0.4 billion gallons in 2013.
The gauge on Alewife Brook at Broadway in Arlington recorded roughly 1.7 billion gallons of flow in 2014. We have other streams such as Beaver Brook, which drains part of Lexington and Waltham. Some water transpires from tree leaves near streams, and some evaporates without being used by plants, people, sewers, or anything else. But where the rest goes is up to us.
Sumner Brown is a Director of the Belmont Citizens Forum.

Sorry, the comment form is closed at this time.